
|
STATISTICAL BRIEF #301
December 2022
Pamela L. Owens, Ph.D., and Brian J. Moore, Ph.D. Introduction An estimated 20.4 million people aged 12 years and older were diagnosed with a substance use disorder (SUD) in 2019, with many receiving care or accessing the behavioral healthcare system through the emergency department (ED).1 The prevalence of SUD remained stable between 2015 and 2019,1 yet SUD-related ED visits have increased substantially in the past 5 years (i.e., a 45 percent increase from 2013 to 2018).2,3 Although estimates of SUD in the past year show racial and ethnic differences (higher prevalence of SUD among White individuals than Black, Hispanic, and Asian individuals),4 little is known about racial and ethnic differences in SUD-related ED utilization. Understanding these differences can help highlight potential inequities in care associated with lack of access to primary SUD-related healthcare and pinpoint areas to target for prevention programs, interventions, and healthcare policies to better ensure equitable care. This Healthcare Cost and Utilization Project (HCUP) Statistical Brief presents statistics on SUD-related ED visits by patient race and ethnicity using weighted estimates from the 2019 Nationwide Emergency Department Sample (NEDS). SUDs include disorders involving alcohol, cannabis, stimulants, opioids, sedatives, hallucinogens, and inhalants, as well as other substances. The number and percentage of SUD-related ED visits are presented for select patient characteristics and primary expected payer. The population rate of SUD-related ED visits is presented by race and ethnicity for select demographic characteristics, including sex, age group, rural/urban location, and the social vulnerability of the county in which the individual resides (i.e., community's ability to prevent human suffering and financial loss during a disaster).5 Because of the large sample size of the NEDS data, small differences can be statistically significant. Thus, only differences greater than or equal to 10 percent are discussed in the text. |
|
Findings
Characteristics of emergency department (ED) visits related to substance use disorders (SUDs), by patient race and ethnicity Figure 1 presents the number and percentage of all ED visits and SUD-related ED visits by patient race and ethnicity. Figure 1. Distribution of all ED visits and SUD-related ED visits, by patient race and ethnicity, 2019
Pie charts showing the number and percentage of all emergency department (ED) visits and substance use disorder (SUD)-related ED visits in 2019 by patient race and ethnicity (Asian/Pacific Islander non-Hispanic [NH], Black NH, Hispanic, White NH, and other NH). All ED visits (N=141,123,400): Asian/Pacific Islander NH, N=3,014,900 (2.1%); Black NH, N=29,218,700 (20.7%); Hispanic, N=21,769,800 (15.4%); White NH, N=77,503,400 (54.9%); Other NH, N=5,769,900 (4.1%). SUD-related ED visits (N=7,996,500): Asian/Pacific Islander NH, N=91,000 (1.1%); Black NH, N=1,651,200 (20.6%); Hispanic, N=980,700 (12.3%); White NH, N=4,788,800 (59.9%); Other NH, N=345,900 (4.3%).
|
|
Table 1 presents the number and percentage of SUD-related ED visits by patient race and ethnicity for select patient-level characteristics.
Table 1. Characteristics of SUD-related ED visits, by patient race and ethnicity, 2019 |
|||||||||||||||||||||||||||||||||||||||||||||||||||||||||||||||||||||||||||||||||||||||||||||||||||||||||||||||||||||||||||||||||||||||||||||||||||||||||||||||||||||||||||||||||||||||||||||||||||||||||||||||||||||||||||||||||||||||||||||||||||||||||||||||||||||||||||||||||||||||||||||||||||||||||
|
|||||||||||||||||||||||||||||||||||||||||||||||||||||||||||||||||||||||||||||||||||||||||||||||||||||||||||||||||||||||||||||||||||||||||||||||||||||||||||||||||||||||||||||||||||||||||||||||||||||||||||||||||||||||||||||||||||||||||||||||||||||||||||||||||||||||||||||||||||||||||||||||||||||||||
|
Population rates of ED visits related to SUDs, by race and ethnicity
Figures 2–5 present the rate per 1,000 population of SUD-related ED visits by race and ethnicity for select demographic characteristics: sex (Figure 2), age group (Figure 3), residence in an urban/rural location (Figure 4), and social vulnerability of residence location (Figure 5). Figure 2. Population rates of SUD-related ED visits by race and ethnicity and sex, 2019
Bar chart showing the rate per 1,000 population of substance use disorder (SUD)-related emergency department (ED) visits in 2019 by sex and by race and ethnicity (Asian/Pacific Islander non-Hispanic [NH], Black NH, Hispanic, White NH, and other NH). Data are provided in Supplemental Table 1.
|
|||||||||||||||||||||||||||||||||||||||||||||||||||||||||||||||||||||||||||||||||||||||||||||||||||||||||||||||||||||||||||||||||||||||||||||||||||||||||||||||||||||||||||||||||||||||||||||||||||||||||||||||||||||||||||||||||||||||||||||||||||||||||||||||||||||||||||||||||||||||||||||||||||||||||
|
Figure 3. Population rates of SUD-related ED visits by race and ethnicity and age, 2019
Bar chart showing the rate per 1,000 population of substance use disorder (SUD)-related emergency department (ED) visits in 2019 by age and by race and ethnicity (Asian/Pacific Islander non-Hispanic [NH], Black NH, Hispanic, White NH, and other NH). Data are provided in Supplemental Table 2.
Figure 4. Population rates of SUD-related ED visits by race and ethnicity and urban/rural location, 2019
Bar chart showing the rate per 1,000 population of substance use disorder (SUD)-related emergency department (ED) visits in 2019 by urban/rural location and by race and ethnicity (Asian/Pacific Islander non-Hispanic [NH], Black NH, Hispanic, White NH, and other NH). Data are provided in Supplemental Table 3.
Figure 5. Population rates of SUD-related ED visits by race and ethnicity and community social vulnerability, 2019
Bar chart showing the rate per 1,000 population of substance use disorder (SUD)-related emergency department (ED) visits in 2019 by community social vulnerability and by race and ethnicity (Asian/Pacific Islander non-Hispanic [NH], Black NH, Hispanic, White NH, and other NH). Data are provided in Supplemental Table 4.
|
|||||||||||||||||||||||||||||||||||||||||||||||||||||||||||||||||||||||||||||||||||||||||||||||||||||||||||||||||||||||||||||||||||||||||||||||||||||||||||||||||||||||||||||||||||||||||||||||||||||||||||||||||||||||||||||||||||||||||||||||||||||||||||||||||||||||||||||||||||||||||||||||||||||||||
|
Population rates of SUD-related ED visits, by race and ethnicity and SUD
Table 2 presents the rate of ED visits per 1,000 population related to specific SUDs by race and ethnicity. A single ED visit may contribute to more than one type of specific SUD category. Table 2. Rates of ED visits per 1,000 population by type of SUD and race and ethnicity, 2019 |
|||||||||||||||||||||||||||||||||||||||||||||||||||||||||||||||||||||||||||||||||||||||||||||||||||||||||||||||||||||||||||||||||||||||||||||||||||||||||||||||||||||||||||||||||||||||||||||||||||||||||||||||||||||||||||||||||||||||||||||||||||||||||||||||||||||||||||||||||||||||||||||||||||||||||
|
|||||||||||||||||||||||||||||||||||||||||||||||||||||||||||||||||||||||||||||||||||||||||||||||||||||||||||||||||||||||||||||||||||||||||||||||||||||||||||||||||||||||||||||||||||||||||||||||||||||||||||||||||||||||||||||||||||||||||||||||||||||||||||||||||||||||||||||||||||||||||||||||||||||||||
References
|
Healthcare Cost and Utilization Project (HCUP) Statistical Briefs provide basic descriptive statistics on a variety of topics using HCUP administrative healthcare data. Topics include hospital inpatient, ambulatory surgery, and emergency department use and costs, quality of care, access to care, medical conditions, procedures, and patient populations, among other topics. The reports are intended to generate hypotheses that can be further explored in other research; the reports are not designed to answer in-depth research questions using multivariate methods.
Data SourceThe estimates in this Statistical Brief are based upon data from the HCUP 2019 Nationwide Emergency Department Sample (NEDS). Supplemental sources included the Agency for Healthcare Research and Quality Social Determinants of Health Databasea and population denominator data for use with HCUP databases, derived from information available from the U.S. Census Bureau.b
Definitions
Diagnoses and Clinical Classifications Software Refined (CCSR) for ICD-10-CM Diagnoses
For emergency department (ED) visits that are treated and released, the
first-listed diagnosis represents the condition, symptom, or problem
identified in the medical record to be chiefly responsible for the ED
services provided. In cases where the first-listed diagnosis is a
symptom or problem, a diagnosis has not been established (confirmed) by
the provider. For ED visits that result in an inpatient admission, the first-listed diagnosis is the principal diagnosis, the condition established after study to be chiefly responsible for the patient's admission to the hospital. Secondary diagnoses are conditions that coexist at the time of the ED visit or inpatient admission, that require or affect patient care treatment received or management, or that develop during the inpatient stay. All-listed diagnoses include the first-listed (principal) diagnosis plus the secondary conditions.
The CCSR aggregates ICD-10-CM diagnosis codes into a manageable number of clinically meaningful categories.c The CCSR is intended to be used analytically to examine patterns of healthcare in terms of cost, utilization, and outcomes; rank utilization by diagnoses; and risk-adjust by clinical condition. The CCSR capitalizes on the specificity of the ICD-10-CM coding scheme and allows ICD-10-CM codes to be classified in more than one category. Approximately 10 percent of diagnosis codes are associated with more than one CCSR category because the diagnosis code documents either multiple conditions or a condition along with a common symptom or manifestation. ICD-10-CM coding definitions for each CCSR category presented in this Statistical Brief can be found in the CCSR reference file, available at www.hcup-us.ahrq.gov/toolssoftware/ccsr/ccs_refined.jsp#download. For this Statistical Brief, v2021.2 of the CCSR was used.
Case definition
For this report, substance use disorder (SUD) visits were defined as ED visits with any-listed diagnosis in the following CCSR diagnosis categories:
Types of hospitals included in the HCUP Nationwide Emergency Department Sample
The Nationwide Emergency Department Sample (NEDS) is based on ED data from community acute care hospitals, which are defined as short-term, non-Federal, general, and other specialty hospitals available to the public. Included among community hospitals are pediatric institutions and hospitals that are part of academic medical centers. Excluded are long-term care facilities such as rehabilitation, psychiatric, and alcoholism and chemical dependency hospitals. Hospitals included in the NEDS have EDs, and no more than 90 percent of their ED visits result in admission.
Unit of analysis
The unit of analysis is the ED visit, not a person or patient. This means that a person who is seen in the ED multiple times in 1 year will be counted each time as a separate visit in the ED.
Population rates
Rates of SUD-related ED visits per 1,000 population were calculated using 2019 ED visit totals in the numerator and U.S. Census Bureau estimates of the 2019 U.S. population by race and ethnicity in the denominator. Individuals with multiple ED visits are counted more than once in the numerator.
Population rate of SUD visits = 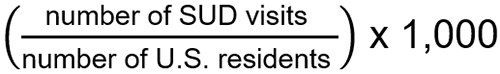
Location of patients' residence
Place of residence is based on the urban-rural classification scheme for U.S. counties developed by the National Center for Health Statistics (NCHS) and based on the Office of Management and Budget (OMB) definition of a metropolitan service area as including a city and a population of at least 50,000 residents:
Metropolitan:
Expected payer
To make coding uniform across all HCUP data sources, the primary expected
payer for the ED visit combines detailed categories into general groups:
ED visits that were expected to be billed to the State Children's Health Insurance Program (SCHIP) are included under Medicaid.
For this Statistical Brief, when more than one payer is listed for an ED visit, the first-listed payer is used.
Social vulnerability
The Centers for Disease Control and Prevention (CDC)/Agency for Toxic Substances and Disease Registry (ATSDR) Social Vulnerability Index (SVI) is a measure of a community's ability to prevent human suffering and financial loss during a disaster. The SVI uses U.S. Census data to determine the social vulnerability of every census tract. Census tracts are subdivisions of counties for which the census collects statistical data. The SVI ranks each tract on 15 social factors, including poverty, lack of vehicle access, and crowded housing, and groups them into four related themes (socioeconomic status, household composition and disability, minority status and language, housing type and transportation). Each tract receives a separate ranking for each of the four themes, as well as an overall ranking. Detailed descriptions of the CDC/ATSDR SVI and data downloads are available at www.atsdr.cdc.gov/placeandhealth/svi/index.html.
Social vulnerability designation in this Statistical Brief is based on the overall SVI measure in the patient county of residence. Patient residence counties with social vulnerability index values in the fourth quartile are included in the most vulnerable communities category. Counties with social vulnerability index values in the lower three quartiles are included in the less vulnerable communities category.
Reporting of race and ethnicity
Data on Hispanic ethnicity are collected differently among the States and also can differ from the Census methodology of collecting information on race (White, Black, Asian/Pacific Islander, American Indian/Alaska Native, Other [including mixed race]) separately from ethnicity (Hispanic, non-Hispanic). State data organizations often collect Hispanic ethnicity as one of several categories that include race. Therefore, for multistate analyses, HCUP creates the combined categorization of race and ethnicity for data from States that report ethnicity separately. When a State data organization collects Hispanic ethnicity separately from race, HCUP uses Hispanic ethnicity to override any other race category to create a Hispanic category for the uniformly coded race and ethnicity data element, while also retaining the original race and ethnicity data. This Statistical Brief reports race and ethnicity for the following categories: Asian/Pacific Islander non-Hispanic (NH), Black NH, Hispanic, White NH, and other NH race/ethnicity.
The Healthcare Cost and Utilization Project (HCUP, pronounced "H-Cup") is a family of healthcare databases and related software tools and products developed through a Federal-State-Industry partnership and sponsored by the Agency for Healthcare Research and Quality (AHRQ). HCUP databases bring together the data collection efforts of State data organizations, hospital associations, and private data organizations (HCUP Partners) and the Federal government to create a national information resource of encounter-level healthcare data. HCUP includes the largest collection of longitudinal hospital care data in the United States, with all-payer, encounter-level information beginning in 1988. These databases enable research on a broad range of health policy issues, including cost and quality of health services, medical practice patterns, access to healthcare programs, and outcomes of treatments at the national, State, and local market levels.
HCUP would not be possible without the contributions of the following data collection Partners from across the United States:
|
Alaska Department of Health Alaska Hospital and Healthcare Association Arizona Department of Health Services Arkansas Department of Health California Department of Health Care Access and Information Colorado Hospital Association Connecticut Hospital Association Delaware Division of Public Health District of Columbia Hospital Association Florida Agency for Health Care Administration Georgia Hospital Association Hawaii Laulima Data Alliance Hawaii University of Hawai’i at Hilo Illinois Department of Public Health Indiana Hospital Association Iowa Hospital Association Kansas Hospital Association Kentucky Cabinet for Health and Family Services Louisiana Department of Health Maine Health Data Organization Maryland Health Services Cost Review Commission Massachusetts Center for Health Information and Analysis Michigan Health & Hospital Association Minnesota Hospital Association Mississippi State Department of Health Missouri Hospital Industry Data Institute |
Montana Hospital Association Nebraska Hospital Association Nevada Department of Health and Human Services New Hampshire Department of Health & Human Services New Jersey Department of Health New Mexico Department of Health New York State Department of Health North Carolina Department of Health and Human Services North Dakota (data provided by the Minnesota Hospital Association) Ohio Hospital Association Oklahoma State Department of Health Oregon Association of Hospitals and Health Systems Oregon Health Authority Pennsylvania Health Care Cost Containment Council Rhode Island Department of Health South Carolina Revenue and Fiscal Affairs Office South Dakota Association of Healthcare Organizations Tennessee Hospital Association Texas Department of State Health Services Utah Department of Health Vermont Association of Hospitals and Health Systems Virginia Health Information Washington State Department of Health West Virginia Department of Health and Human Resources Wisconsin Department of Health Services Wyoming Hospital Association |
The HCUP Nationwide Emergency Department Sample (NEDS) is a unique and powerful database that yields national estimates of emergency department (ED) visits. The NEDS was constructed using records from both the HCUP State Emergency Department Databases (SEDD) and the State Inpatient Databases (SID). The SEDD capture information on ED visits that do not result in an admission (i.e., patients who were treated in the ED and then released from the ED, or patients who were transferred to another hospital); the SID contain information on patients initially seen in the ED and then admitted to the same hospital. The NEDS was created to enable analyses of ED utilization patterns and support public health professionals, administrators, policymakers, and clinicians in their decision making regarding this critical source of care. The NEDS is produced annually beginning in 2006. Over time, the sampling frame for the NEDS has changed; thus, the number of States contributing to the NEDS varies from year to year. The NEDS is intended for national estimates only; no State-level estimates can be produced. The unweighted sample size for the 2019 NEDS is 33,147,251 (weighted, this represents 143,432,284 ED visits).
For More InformationFor other information on hospitalizations related to substance use disorders and differences in hospitalizations by patient race and ethnicity, refer to the Mental and Substance Use Disorders as well as the Race and Ethnicity HCUP Statistical Briefs topic areas located at www.hcup-us.ahrq.gov/reports/statbriefs/sbtopic.jsp.
For additional HCUP statistics, visit:
For more information about HCUP, visit www.hcup-us.ahrq.gov/.
For a detailed description of HCUP and more information on the design of the Nationwide Emergency Department Sample (NEDS), please refer to the following database documentation:
Agency for Healthcare Research and Quality. Overview of the Nationwide Emergency Department Sample (NEDS). Healthcare Cost and Utilization Project (HCUP). Rockville, MD: Agency for Healthcare Research and Quality. Updated October 2021. www.hcup-us.ahrq.gov/nedsoverview.jsp. Accessed November 8, 2022.
Suggested CitationOwens PL (AHRQ), Moore BJ (IBM). Racial and Ethnic Differences in Emergency Department Visits Related to Substance Use Disorders, 2019. HCUP Statistical Brief #301. December 2022. Agency for Healthcare Research and Quality, Rockville, MD. www.hcup-us.ahrq.gov/reports/statbriefs/sb301-ED-Substance-Use-Disorders-Race-2019.pdf.
AcknowledgmentsThe authors would like to acknowledge the contributions of Minya Sheng of IBM.
***
AHRQ welcomes questions and comments from readers of this publication who are interested in obtaining more information about access, cost, use, financing, and quality of healthcare in the United States. We also invite you to tell us how you are using this Statistical Brief and other HCUP data and tools, and to share suggestions on how HCUP products might be enhanced to further meet your needs. Please email us at hcup@ahrq.gov or send a letter to the address below:
Joel W. Cohen, Ph.D., Director
Center for Financing, Access and Cost Trends
Agency for Healthcare Research and Quality
5600 Fishers Lane
Rockville, MD 20857
This Statistical Brief was posted online on December 8, 2022.
a Agency for Healthcare Research and Quality. Social Determinants of Health Database. Content last reviewed July 2022. www.ahrq.gov/sdoh/data-analytics/sdoh-data.html. Accessed November 8, 2022.| Supplemental Table 1. Population rates of SUD-related ED visits by race and ethnicity and sex, 2019, for data presented in Figure 2 | ||||||
| Characteristic | Rate per 1,000 population of SUD-related ED visits | |||||
|---|---|---|---|---|---|---|
| All races and ethnicities | Asian/Pacific Islander NH | Black NH | Hispanic | White NH | Other NH | |
| Overall | 28.5 | 5.3 | 48.3 | 17.6 | 29.1 | 40.0 |
| Sex | ||||||
| Male | 37.3 | 7.6 | 66.9 | 25.5 | 36.4 | 54.5 |
| Female | 20.1 | 3.2 | 31.4 | 9.6 | 22.0 | 25.7 |
| Supplemental Table 2. Population rates of SUD-related ED visits by race and ethnicity and age, 2019, for data presented in Figure 3 | ||||||
| Characteristic | Rate per 1,000 population of SUD-related ED visits | |||||
|---|---|---|---|---|---|---|
| All races and ethnicities | Asian/Pacific Islander NH | Black NH | Hispanic | White NH | Other NH | |
| Overall | 28.5 | 5.3 | 48.3 | 17.6 | 29.1 | 40.0 |
| Age group, years | ||||||
| 0–17 | 2.6 | 0.7 | 2.8 | 1.9 | 2.9 | 3.0 |
| 18–44 | 39.5 | 7.5 | 61.1 | 24.0 | 42.5 | 63.6 |
| 45–64 | 41.9 | 6.2 | 82.0 | 30.7 | 38.6 | 77.7 |
| 65+ | 19.3 | 3.6 | 36.7 | 16.4 | 18.0 | 41.8 |
| Supplemental Table 3. Population rates of SUD-related ED visits by race and ethnicity and urban/rural location, 2019, for data presented in Figure 4 | ||||||
| Characteristic | Rate per 1,000 population of SUD-related ED visits | |||||
|---|---|---|---|---|---|---|
| All races and ethnicities | Asian/Pacific Islander NH | Black NH | Hispanic | White NH | Other NH | |
| Overall | 28.5 | 5.3 | 48.3 | 17.6 | 29.1 | 40.0 |
| Urban/rural location | ||||||
| Rural | 24.4 | 10.2 | 30.0 | 16.4 | 22.6 | 45.1 |
| Micropolitan | 29.7 | 11.8 | 39.9 | 13.6 | 29.8 | 31.9 |
| Metropolitan | 28.7 | 5.1 | 49.5 | 17.8 | 29.6 | 40.4 |
| Supplemental Table 4. Population rates of SUD-related ED visits by race and ethnicity and community social vulnerability, 2019, for data presented in Figure 5 | ||||||
| Characteristic | Rate per 1,000 population of SUD-related ED visits | |||||
|---|---|---|---|---|---|---|
| All races and ethnicities | Asian/Pacific Islander NH | Black NH | Hispanic | White NH | Other NH | |
| Overall | 28.5 | 5.3 | 48.3 | 17.6 | 29.1 | 40.0 |
| Community vulnerability | ||||||
| Less vulnerable communities | 28.0 | 5.5 | 45.4 | 16.9 | 28.5 | 37.8 |
| More vulnerable communities | 30.4 | 4.4 | 54.4 | 18.7 | 32.4 | 46.9 |
![Pie charts showing the number and percentage of all emergency department (ED) visits and substance use disorder (SUD)-related ED visits in 2019 by patient race and ethnicity (Asian/Pacific Islander non-Hispanic [NH], Black NH, Hispanic, White NH, and other NH). All ED visits (N=141,123,400): Asian/Pacific Islander NH, N=3,014,900 (2.1%); Black NH, N=29,218,700 (20.7%); Hispanic, N=21,769,800 (15.4%); White NH, N=77,503,400 (54.9%); Other NH, N=5,769,900 (4.1%). SUD-related ED visits (N=7,996,500): Asian/Pacific Islander NH, N=91,000 (1.1%); Black NH, N=1,651,200 (20.6%); Hispanic, N=980,700 (12.3%); White NH, N=4,788,800 (59.9%); Other NH, N=345,900 (4.3%).](sb301_fig1.png)
![Bar chart showing the rate per 1,000 population of substance use disorder (SUD)-related emergency department (ED) visits in 2019 by sex and by race and ethnicity (Asian/Pacific Islander non-Hispanic [NH], Black NH, Hispanic, White NH, and other NH). Data are provided in Supplemental Table 1.](sb301_fig2.png)
![Bar chart showing the rate per 1,000 population of substance use disorder (SUD)-related emergency department (ED) visits in 2019 by age and by race and ethnicity (Asian/Pacific Islander non-Hispanic [NH], Black NH, Hispanic, White NH, and other NH). Data are provided in Supplemental Table 2.](sb301_fig3.png)
![Bar chart showing the rate per 1,000 population of substance use disorder (SUD)-related emergency department (ED) visits in 2019 by urban/rural location and by race and ethnicity (Asian/Pacific Islander non-Hispanic [NH], Black NH, Hispanic, White NH, and other NH). Data are provided in Supplemental Table 3.](sb301_fig4.png)
![Bar chart showing the rate per 1,000 population of substance use disorder (SUD)-related emergency department (ED) visits in 2019 by community social vulnerability and by race and ethnicity (Asian/Pacific Islander non-Hispanic [NH], Black NH, Hispanic, White NH, and other NH). Data are provided in Supplemental Table 4.](sb301_fig5.png)