STATISTICAL BRIEF #6
|
|
May 2006
C. Allison Russo, M.P.H. and Anne Elixhauser, Ph.D.
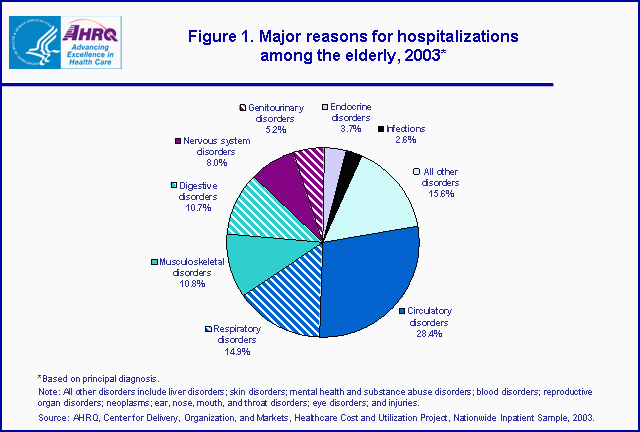
Introduction Hospitalizations among the elderly population age 65 and older represent a significant portion of the annual expenditures on hospital care. Policy makers are concerned about the utilization and costs of hospital care among the elderly because government insurance programs (Medicare and Medicaid) bear the greatest financial burden for healthcare in this population, and the number of elderly will continue to grow in the coming years. This Statistical Brief presents data from the Healthcare Cost and Utilization Project (HCUP) on patterns of hospital utilization and expense for the treatment of individuals age 65 and older in 2003. Variations in hospital utilization among these patients are illustrated according to condition and procedure. All differences between estimates noted in the text are statistically significant at the 0.05 level or better. Findings Persons age 65 and older had more hospital stays than any other age group in 2003. While the elderly comprised about 12 percent of the U.S. population,* they accounted for one out of three hospital stays (13.2 million hospitalizations) and 43.6 percent of the national hospital bill—nearly $329 billion. Table 1 shows the characteristics of hospitalizations among the elderly compared to the non-elderly. The mean length of stay for patients 65 and older was 1.7 days longer and mean hospital charges were 46 percent higher than non-elderly hospital stays, but there was no difference in mean charges per day. Compared to non-elderly patients, a larger proportion of hospitalizations among the elderly were admitted through the emergency department. The proportion of elderly patients who died during their hospital stay was five times higher than in-hospital deaths among the non-elderly. Major reasons for hospital stays among the elderly Figure 1 illustrates the major reasons for hospital admissions among the elderly, organized by body system. The most common reason for hospitalization was related to circulatory disorders, accounting for 28.4 percent of all hospital stays for individuals age 65 and older. Respiratory disorders were the next most common category of conditions, comprising 14.9 percent of all hospitalizations in the elderly. Musculoskeletal and digestive disorders constituted 10.8 percent and 10.7 percent, respectively, of all hospital stays among older adults. Patients with nervous system disorders accounted for 8.0 percent of all hospitalizations within this population. Three other categories each resulted in 3 to 5 percent of all hospital stays in the elderly: genitourinary disorders, endocrine disorders, and infections. |
|
Most frequent specific conditions causing hospital stays in the elderly population
Table 2 displays the 15 most frequent conditions causing admission to the hospital for individuals age 65 and older. These 15 conditions accounted for nearly half of all hospital stays among the elderly. Congestive heart failure was the single most common reason for hospitalization in this population, resulting in 839,300 hospital stays, or 6.3 percent of all hospitalizations among the elderly. Pneumonia was the next most common reason for admission to the hospital for elderly Americans, with 770,400 hospital stays. These conditions were followed by three others related to the heart—coronary artherosclerosis, cardiac dysrhythmias, and acute myocardial infarction—which together accounted for more than 12 percent of all hospitalizations among the elderly. About 3 percent of all hospital stays in this population resulted from chronic obstructive pulmonary disease, stroke, osteoarthritis, and rehabilitation, respectively. Fluid and electrolyte disorders, chest pain, urinary tract infection, hip fracture, complications of devices and grafts, and septicemia each were responsible for about 2 percent of hospital stays among the elderly. Most frequent procedures performed during hospital stays in the elderly population Table 3 illustrates the most common procedures performed during hospitalizations among the elderly. In 2003, 1,167,600 blood transfusions were performed on hospitalized elderly patients, comprising about 60 percent of all blood transfusions performed in the hospital. Nearly one out of every 11 elderly patients in the hospital received blood transfusions. Four of the most common procedures performed on elderly patients were related to the heart: diagnostic cardiac catheterization, percutaneous coronary angioplasty (PTCA), insertion and removal of cardiac pacemakers, and coronary artery bypass graft (CABG). Knee replacements, hip replacements, and treatment of hip fractures ranked 9th, 10th, and 11th and reflect problems of osteoarthritis and osteoporosis. Colorectal resection was also frequently performed in this age group, ranking 15th. Major diagnostic procedures included upper gastrointestinal endoscopy, colonoscopy and biopsy, and bronchoscopy. Finally, also among the top 15 procedures were respiratory intubation and mechanical ventilation (being on a respirator), hemodialysis (for renal failure), and enteral and parenteral nutrition (aimed at providing nutritional support when patients cannot eat for extended periods of time). Data Source The estimates in this Statistical Brief are based upon data from the HCUP 2003 Nationwide Inpatient Sample (NIS). Definitions Types of hospitals included in HCUP HCUP is based on data from community hospitals, defined as short-term, non-Federal, general and other hospitals, excluding hospital units of other institutions (e.g., prisons). HCUP data include OB-GYN, ENT, orthopedic, cancer, pediatric, public, and academic medical hospitals. They exclude long-term care, rehabilitation, psychiatric, and alcoholism and chemical dependency hospitals, but these types of discharges are included if they are from community hospitals. Diagnoses, Procedures, and Clinical Classifications Software (CCS) The principal diagnosis is that condition established after study to be chiefly responsible for the patient’s admission to the hospital. All-listed procedures include all procedures performed during the hospital stay. CCS categorizes patient diagnoses and procedure codes into clinically meaningful categories. This "clinical grouper" makes it easier to quickly understand patterns of diagnoses and procedures. Unit of analysis The unit of analysis is the hospital discharge (i.e., the hospital stay), not a person or patient. This means that a person who is admitted to the hospital multiple times in one year will be counted each time as a separate "discharge" from the hospital. Charges Charges represent what the hospital billed for the case. Hospital charges reflect the amount the hospital charged for the entire hospital stay and do not include professional (MD) fees. For the purposes of this Statistical Brief, charges are rounded to the nearest hundred dollars. Emergency admission Admission source indicates where the patient was located prior to admission to the hospital. Emergency admission indicates the patient was admitted to the hospital through the emergency department. Discharge status Discharge status indicates the disposition of the patient at discharge from the hospital and includes routine (to home), transfer to another short-term hospital, other transfers (including skilled nursing facility, intermediate care, and another type of facility such as a nursing home), home healthcare, against medical advice (AMA), or died in the hospital. About the NIS The HCUP Nationwide Inpatient Sample (NIS) is a nationwide database of hospital inpatient stays. The NIS is nationally representative of all community hospitals (i.e., short-term, non-Federal, non-rehabilitation hospitals). The NIS is a sample of hospitals and it includes all patients from each hospital, regardless of payer. It is drawn from a sampling frame that contains hospitals comprising 90 percent of all discharges in the United States. The vast size of the NIS allows the study of topics at both the national and regional levels for specific subgroups of patients. In addition, NIS data are standardized across years to facilitate ease of use. About HCUP HCUP is a family of powerful healthcare databases, software tools, and products for advancing research. Sponsored by the Agency for Healthcare Research and Quality (AHRQ), HCUP includes the largest all-payer encounter-level collection of longitudinal healthcare data (inpatient, ambulatory surgery, and emergency department) in the United States, beginning in 1988. HCUP is a Federal-State-Industry Partnership that brings together the data collection efforts of many organizations—such as State data organizations, hospital associations, private data organizations, and the Federal government—to create a national information resource. For more information about HCUP, visit http://www.hcup-us.ahrq.gov/. HCUP would not be possible without the contributions of the following data collection partners from across the United States: Arizona Department of Health Services California Office of Statewide Health Planning & Development Colorado Health & Hospital Association Connecticut Integrated Health Information (Chime, Inc.) Florida Agency for Health Care Administration Georgia GHA: An Association of Hospitals & Health Systems Hawaii Health Information Corporation Illinois Health Care Cost Containment Council Indiana Hospital & Health Association Iowa Hospital Association Kansas Hospital Association Kentucky Department for Public Health Maine Health Data Organization Maryland Health Services Cost Review Commission Massachusetts Division of Health Care Finance and Policy Michigan Health & Hospital Association Minnesota Hospital Association Missouri Hospital Industry Data Institute Nebraska Hospital Association Nevada Center for Health Information Analysis New Hampshire Department of Health & Human Services New Jersey Department of Health and Senior Services New York State Department of Health North Carolina Department of Health and Human Services Ohio Hospital Association Oregon Office of Oregon Health Policy and Research and the Office of Oregon Health Pennsylvania Health Care Cost Containment Council Rhode Island Department of Health South Carolina State Budget and Control Board South Dakota Association of Healthcare Organizations Tennessee Hospital Association Texas Department of State Health Services Utah Department of Health Vermont Association of Hospitals and Health Systems Virginia Health Information Washington State Department of Health West Virginia Health Care Authority Wisconsin Department of Health and Family Services For additional HCUP statistics, visit HCUPnet, our interactive query system at https://datatools.ahrq.gov/hcupnet. References For a detailed description of HCUP and more information on the design of the NIS and methods to calculate estimates, please refer to the following publications: Steiner, C., Elixhauser, A., Schnaier, J. The Healthcare Cost and Utilization Project: An Overview. Effective Clinical Practice 5(3):143—51, 2002 Design of the HCUP Nationwide Inpatient Sample, 2003. Online. June 14, 2005. U.S. Agency for Healthcare Research and Quality. http://www.hcup-us.ahrq.gov/db/nation/nis/reports/NIS_2003_Design_Report.jsp Houchens, R., Elixhauser, A. Final Report on Calculating Nationwide Inpatient Sample (NIS) Variances, 2001. HCUP Methods Series Report #2003-2. Online. June 2005 (revised June 6, 2005). U.S. Agency for Healthcare Research and Quality. http://www.hcup-us.ahrq.gov/reports/methods/2003_02.pdf Suggested Citation Russo, C. A. and Elixhauser, A. Hospitalizations in the Elderly Population, 2003. Statistical Brief #6. May 2006. Agency for Healthcare Research and Quality, Rockville, Md. http://www.hcup-us.ahrq.gov/reports/statbriefs/sb6.pdf *** AHRQ welcomes questions and comments from readers of this publication who are interested in obtaining more information about access, cost, use, financing, and quality of healthcare in the United States. We also invite you to tell us how you are using this Statistical Brief and other HCUP data and tools, and to share suggestions on how HCUP products might be enhanced to further meet your needs. Please e-mail us at hcup@ahrq.gov or send a letter to the address below:Irene Fraser, Ph.D., Director Center for Delivery, Organization, and Markets Agency for Healthcare Research and Quality 540 Gaither Road Rockville, MD 20850 *Source: U.S. Census Bureau, Population Division, Census 2003. http://www.census.gov/popest/ . |
| Table 1. Characteristics of hospitalizations among non-elderly and elderly populations, 2003 | ||||
| Younger than 65 years | 65 years and older | |||
| Percentage of U.S. population* | 88% | 12% | ||
| Number of hospital stays (percent) | 24,931,800 (65.3%) | 13,232,900 (34.7%) | ||
| Mean length of stay, days | 4.0 | 5.7 | ||
| Mean charges | $17,000 | $24,800 | ||
| Mean charge per day | $4,250 | $4,350 | ||
| National bill (aggregate charges) | $424 billion (56.3%) | $329 billion (43.6%) | ||
| Percentage admitted through the emergency department | 36.2% | 57.4% | ||
| Percentage died in the hospital | 0.9% | 4.7% | ||
| *U.S. Census Bureau, Population Division, Census 2003.
Source: AHRQ, Center for Delivery, Organization, and Markets, Healthcare Cost and Utilization Project, Nationwide Inpatient Sample, 2003. | ||||
| Table 2. Most frequent conditions causing hospitalizations among the elderly, 2003 | |||
| Rank | Principal diagnosis | Number of hospitalizations in the elderly | Percentage of all hospitalizations in the elderly |
| 1 | Congestive heart failure | 839,300 | 6.3 |
| 2 | Pneumonia | 770,400 | 5.8 |
| 3 | Coronary atherosclerosis | 675,700 | 5.1 |
| 4 | Cardiac dysrhythmias | 484,200 | 3.7 |
| 5 | Acute myocardial infarction | 449,000 | 3.4 |
| 6 | Chronic obstructive pulmonary disease | 408,100 | 3.1 |
| 7 | Stroke | 391,900 | 3.0 |
| 8 | Osteoarthritis | 364,400 | 2.8 |
| 9 | Rehabilitation care, fitting of prostheses, and adjustment of devices | 324,500 | 2.5 |
| 10 | Fluid and electrolyte disorders | 302,200 | 2.3 |
| 11 | Chest pain | 296,400 | 2.2 |
| 12 | Urinary tract infections | 282,700 | 2.1 |
| 13 | Hip fracture | 275,900 | 2.1 |
| 14 | Complication of medical device, implant, or graft | 270,600 | 2.0 |
| 15 | Septicemia | 253,400 | 1.9 |
| Total admissions for the elderly for the top 15 conditions | 6,388,700 | 48.3 | |
| Source: AHRQ, Center for Delivery, Organization, and Markets, Healthcare Cost and Utilization Project, Nationwide Inpatient Sample, 2003. | |||
| Table 3. Most frequent procedures performed during hospitalizations among the elderly, 2003 | |||
| Rank | All-listed procedures | Number of elderly admissions with procedure | Percentage of procedures performed in the elderly |
| 1 | Blood transfusion | 1,167,600 | 59.1 |
| 2 | Diagnostic cardiac catheterization, coronary arteriography | 852,300 | 49.6 |
| 3 | Upper Gastrointestinal endoscopy, biopsy | 690,700 | 55.6 |
| 4 | Respiratory intubation and mechanical ventilation | 500,900 | 44.4 |
| 5 | Percutaneous coronary angioplasty (PTCA) | 401,900 | 50.2 |
| 6 | Colonoscopy and biopsy | 381,800 | 60.0 |
| 7 | Hemodialysis | 317,600 | 48.0 |
| 8 | Insertion, revision, replacement, removal of cardiac pacemaker or cardioverter/defibrillator | 276,100 | 77.0 |
| 9 | Knee replacement | 256,500 | 59.1 |
| 10 | Hip replacement, total and partial | 238,600 | 69.5 |
| 11 | Treatment, fracture or dislocation of hip and femur | 209,400 | 68.9 |
| 12 | Coronary artery bypass graft (CABG) | 196,300 | 56.4 |
| 13 | Enteral and parenteral nutrition | 191,000 | 45.6 |
| 14 | Diagnostic bronchoscopy and biopsy | 168,200 | 49.9 |
| 15 | Colorectal resection | 167,100 | 53.0 |
| Source: AHRQ, Center for Delivery, Organization, and Markets, Healthcare Cost and Utilization Project, Nationwide Inpatient Sample (NIS), 2003. | |||
|