STATISTICAL BRIEF #92
|
|
July 2010
Pamela L. Owens, Ph.D., Ryan Mutter, Ph.D., and Carol Stocks, R.N., M.H.S.A.
Introduction An estimated one in three individuals has suffered from a mental health or substance abuse condition within the last 12 months,1 yet the community treatment system to support services for these individuals is regarded as ineffective.2 This is particularly evident in emergency department (ED) utilization. The number of patients with mental health and substance abuse (MHSA) conditions treated in EDs has been on the rise for more than a decade.3 Not only is this of concern to members of the mental health community, but also to the members of the emergency medicine community who are concerned that ED overcrowding results in decreased quality of care and increased likelihood of medical error.4 As a specific example, a 2008 American College of Emergency Physicians’ ED directors’ survey reported that patients with MHSA conditions not only have had increased ED boarding times, but also that the resource-intensive care required for these patients has an impact on the quality of care for all other patients in the ED.5 This Statistical Brief presents data from the Healthcare Cost and Utilization Project (HCUP) Nationwide Emergency Department Sample (NEDS) on MHSA-related ED visits among adults in 2007. Specifically, patient and utilization characteristics of ED visits for MHSA are discussed and compared with all other types of ED visits. The distribution of MHSA-related ED visits are presented by age and primary expected payer. The MHSA conditions described here include those conditions found in the Diagnostic and Statistics Manual of Mental Disorders, Fourth Edition, excluding dementia and intellectual disabilities. The Brief also provides information about the types of MHSA conditions by age and primary expected payer. In addition to prevalence estimates, data on the likelihood of hospital admission are presented. Estimates are based on all-listed diagnoses. All differences between estimates noted in the text are statistically significant at the 0.05 level or better. Findings General findings In 2007, of the 95 million visits made to the emergency department (ED) by adults in the U.S., 12.0 million (12.5 percent) were related to MHSA (table 1)—4.1 million of which had mental health or substance abuse conditions listed as a primary diagnosis. Nearly 41 percent (4.8 million visits) of these MHSA-related ED visits resulted in hospital admission—an admission rate that is over two and a half times that for ED visits related to other conditions (figure 1). Table 1 shows that the majority of MHSA-related ED visits were for women (53.9 percent). The largest percentage of MHSA-related ED visits (46.6 percent) were for younger adults ages 18 to 44 years, followed by 45 to 64 year olds (34.5 percent). Adults 65 years and older accounted for nearly one in five (18.9 percent) MHSA-related ED visits. Compared with ED visits for other conditions, those related to MHSA were more likely to be for 45 to 64 year olds (34.5 percent versus 25.8 percent) and less likely to be for adults 18 to 44 years (46.6 percent versus 52.4 percent) and 65 years and older (18.9 percent versus 21.8 percent). |
|
Medicare, healthcare insurance for those 65 years and older or those on Social Security Disability Insurance, was billed more frequently for MHSA-related ED visits (30.1 percent), followed by private insurance (25.7 percent), uninsured (20.6 percent), and Medicaid (19.8 percent). In contrast, private insurance was billed more frequently for most other types of ED visits (34.5 percent), followed by Medicare (24.7 percent), uninsured (20.6 percent), and Medicaid (14.9 percent). Types of MHSA-related ED visits Table 1 shows the distribution of MHSA-related ED visits, including those related to only mental health conditions (i.e., not substance abuse condition), those related to only substance abuse conditions (i.e., not mental health conditions), and those related to co-occurring MHSA conditions. Over 7.6 million ED visits related to mental health conditions only, accounting for 63.7 percent of all MHSA-related ED visits. Nearly 3.0 million ED visits related to substance abuse conditions only, accounting for 24.4 percent of all MHSA-related ED visits. Over 1.4 million visits related to co-occurring MHSA conditions, accounting for 11.9 percent of MHSA-related ED visits. Patient and payer characteristics of types of MHSA-related ED visits Table 1 shows that ED visits related to mental health conditions were more likely to be for women (65.4 percent), while ED visits related to substance abuse conditions (29.3 percent) and co-occurring MHSA conditions (43.0 percent) were less likely to be for women and more likely to be for men. Regardless of the type of condition, MHSA-related ED visits were more likely to be for younger adults 18 to 44 years. ED visits related to co-occurring MHSA conditions were disproportionately more likely to be for 18–44 year olds—58.8 percent of ED visits for co-occurring MHSA conditions were for 18–44 year olds (versus 42.7 percent for mental conditions only and 50.7 percent for substance abuse conditions only). ED visits related to mental health conditions were disproportionately more likely to be for the oldest adults 65 years and older (25.3 versus 9.1 and 5.2 percent related to substance abuse conditions and co-occurring MHSA conditions, respectively). Medicare was billed more frequently for mental health-related ED visits (37.2 percent), followed by private insurance (27.5 percent) and Medicaid (18.3 percent). Fewer mental health-related ED visits were billed as uninsured (13.8 percent). In contrast, the largest percentage of substance abuse-related ED visits was billed as uninsured (35.6 percent). Private insurance accounted for 22.2 percent of substance abuse-related ED visits, followed by Medicaid (20.7 percent) and Medicare (16.3 percent). Nearly one-fourth of ED visits for co-occurring MHSA conditions were billed as uninsured (26.3 percent) or to Medicaid (25.7 percent) or private insurance (23.4 percent). Medicare accounted for 20.3 percent of ED visits related to co-occurring MHSA conditions. Admission status for MHSA-related ED visits, by age and expected payer Figure 1 highlights that ED visits related to co-occurring MHSA conditions were the most likely to result in hospital admission (57.1 percent), followed by visits related to mental health conditions (39.3 percent), and substance abuse conditions (36.6 percent). Figures 2 and 3 show that visits related to co-occurring MHSA conditions were more likely to result in hospital admission than either visits related to mental health only or substance abuse only within age and payer groups. Admission rates increased with age, regardless of the type of MHSA-related ED visits (figure 2). ED visits for adults 18 to 44 years with mental health conditions were the least likely to result in hospital admission (20.3 percent), while ED visits for adults 65 years and older with co-occurring MHSA conditions were the most likely to result in admission (82.0 percent). Hospital admission rates varied by expected payer (figure 3). ED visits billed to Medicare were more likely to result in admission, regardless of the type of MHSA condition (58.9, 58.0, and 70.8 percent, related to mental health only, substance abuse only, and co-occurring MHSA, respectively). ED visits billed as uninsured were the least likely to result in hospital admission, regardless of the type of MHSA condition (15.1, 23.8, and 41.3 percent related to mental health only, substance abuse only and co-occurring MHSA, respectively). Number and distribution of ED visits for the most frequent all-listed MHSA conditions, by age and expected payer As shown in table 2, the most common all-listed reason for a MHSA-related ED visit was mood disorder (42.7 percent of MHSA-related ED visits), followed by anxiety disorders (26.1 percent), alcohol disorders (22.9 percent), drug disorders (17.6 percent), schizophrenia and other psychoses (9.9 percent), and intentional self-harm (6.6 percent). The top five conditions accounted for 96.0 percent of all MHSA-related cases in the ED, taking into account that there may be multiple diagnoses on an ED record. Some variation was noted by age and expected payer. For example, among adults 65 years and older, mood disorders accounted for over half of the ED visits (52.0 percent) followed by anxiety disorders (28.8 percent), and schizophrenia and other psychoses (11.4 percent). Although mood disorders were the most frequent condition for all age groups and most payers, alcohol-related conditions were the most frequent condition among the uninsured. Figure 4 shows the age distribution for specific MHSA-related ED visits by condition. ED visits for intentional self-harm (69.0 percent) and drug abuse conditions (63.1 percent) were disproportionately more likely to be for young adults 18–44 years old—accounting for almost 500,000 ED visits and over 1.3 million ED visits in 2007, respectively. Figure 5 shows that the payer distribution for each of the MHSA condition specific ED visits varied considerably. For example, ED visits related to mood disorders and those related to schizophrenia and other psychoses were disproportionately more likely to be billed to Medicare (36.6 and 47.4 percent, respectively). ED visits related to drug abuse, alcohol abuse, and intentional self-harm were more frequently billed as uninsured than any other payer (33.3, 31.9, and 29.3 percent, respectively). Data Source The estimates in this Statistical Brief are based upon data from the HCUP 2007 Nationwide Emergency Department Sample (NEDS). The statistics can also be generated from HCUPnet, a free, online query system that provides users with immediate access to the largest set of publicly available, all-payer national, regional, and State-level hospital care databases from HCUP. Definitions Diagnoses, ICD-9-CM, and Clinical Classifications Software (CCS) The principal diagnosis is that condition established after study to be chiefly responsible for the patient’s admission to the hospital. Secondary diagnoses are concomitant conditions that coexist at the time of admission or that develop during the stay. All-listed diagnoses include the principal diagnosis plus these additional secondary conditions. ICD-9-CM is the International Classification of Diseases, Ninth Revision, Clinical Modification, which assigns numeric codes to diagnoses. There are about 13,600 ICD-9-CM diagnosis codes. CCS categorizes ICD-9-CM diagnoses and procedures into clinically meaningful categories.6 This "clinical grouper" makes it easier to quickly understand patterns of diagnoses and procedures. Mental health conditions include CCS 650–659, 662, and 670. Substance abuse conditions include CCS 661 and 662. Case definition All-listed CCS diagnosis and external cause of injury codes used to identify mental health and substance abuse cases included: | ||||||||||||||||||||||||
| ||||||||||||||||||||||||
|
Although dementia (CCS=653) and intellectual disability/developmental disorders (CCS=654) are listed in the Diagnostic and Statistical Manual of Mental Disorders, Fourth Edition, these diagnoses, which are frequently characterized by the development of multiple cognitive impairments related to medical conditions, frequently require more medical than psychiatric treatment and thus are excluded from the analysis. Treat-and-release ED visits Treat-and-release ED visits were those ED visits in which patients are treated and released from that ED (i.e., they are not admitted to that specific hospital). While the majority of treat-an-release patients (92.2%) were discharged home, some were transferred to another acute care facility (1.5%), left against medical advice (1.7%), went to another type of long-term or intermediate care facility (nursing home or psychiatric treatment facility) (1.6%), referred to home healthcare (0.5%) or died (0.2%), or discharged alive but the destination is unknown (2.2%). ED visits resulting in hospital admission ED visits resulting in a hospital stay included those patients initially seen in the ED and then admitted to the same hospital. Types of hospitals included in HCUP HCUP is based on data from community hospitals, defined as short-term, non-Federal, general and other hospitals, excluding hospital units of other institutions (e.g., prisons). HCUP data include OB-GYN, ENT, orthopedic, cancer, pediatric, public, and academic medical hospitals. They exclude long-term care, rehabilitation, psychiatric, and alcoholism and chemical dependency hospitals, but these types of ED visits are included if they are from community hospitals. Unit of analysis The unit of analysis is the ED visit, not a person or patient. This means that a person who visits the ED multiple times in one year will be counted each time as a separate ED visit. Payer Payer is the primary expected payer for the ED visit. To make coding uniform across all HCUP data sources, payer combines detailed categories into more general groups:
About HCUP HCUP is a family of powerful healthcare databases, software tools, and products for advancing research. Sponsored by the Agency for Healthcare Research and Quality (AHRQ), HCUP includes the largest all-payer encounter-level collection of longitudinal healthcare data (inpatient, ambulatory surgery, and emergency department) in the United States, beginning in 1988. HCUP is a Federal-State-Industry Partnership that brings together the data collection efforts of many organizations—such as State data organizations, hospital associations, private data organizations, and the Federal government—to create a national information resource. HCUP would not be possible without the contributions of the following data collection Partners from across the United States: Arizona Department of Health Services Arkansas Department of Health California Office of Statewide Health Planning and Development Colorado Hospital Association Connecticut Hospital Association Florida Agency for Health Care Administration Georgia Hospital Association Hawaii Health Information Corporation Illinois Department of Public Health Indiana Hospital Association Iowa Hospital Association Kansas Hospital Association Kentucky Cabinet for Health and Family Services Louisiana Department of Health and Hospitals Maine Health Data Organization Maryland Health Services Cost Review Commission Massachusetts Division of Health Care Finance and Policy Michigan Health & Hospital Association Minnesota Hospital Association Missouri Hospital Industry Data Institute Nebraska Hospital Association Nevada Department of Health and Human Services New Hampshire Department of Health & Human Services New Jersey Department of Health and Senior Services New Mexico Health Policy Commission New York State Department of Health North Carolina Department of Health and Human Services Ohio Hospital Association Oklahoma State Department of Health Oregon Association of Hospitals and Health Systems Pennsylvania Health Care Cost Containment Council Rhode Island Department of Health South Carolina State Budget & Control Board South Dakota Association of Healthcare Organizations Tennessee Hospital Association Texas Department of State Health Services Utah Department of Health Vermont Association of Hospitals and Health Systems Virginia Health Information Washington State Department of Health West Virginia Health Care Authority Wisconsin Department of Health Services Wyoming Hospital Association About the NEDS The HCUP Nationwide Emergency Department Sample (NEDS) is a nationwide database of hospital-based ED visits. The NEDS is nationally representative of all community hospital-based emergency departments (i.e., short-term, non-Federal, non-rehabilitation hospital-based emergency departments). The NEDS is a 20% stratified sample of hospital-based EDs and includes records on all patients, regardless of payer. The NEDS contains information on 26 million records (unweighted) on ED visits at over 950 hospitals in 27 states. The vast size of the NEDS allows the study of topics at both the national and regional levels for specific subgroups of patients. The NEDS is produced annually, beginning with the 2006 data year. About HCUPnet HCUPnet is an online query system that offers instant access to the largest set of all-payer healthcare databases that are publicly available. HCUPnet has an easy step-by-step query system, allowing for tables and graphs to be generated on national and regional statistics, as well as trends for community hospitals in the U.S. HCUPnet generates statistics using data from HCUP's Nationwide Inpatient Sample (NIS), the Kids' Inpatient Database (KID), the Nationwide Emergency Department Sample (NEDS), the State Inpatient Databases (SID) and the State Emergency Department Databases (SEDD). For More Information For more information about HCUP, visit http://www.hcup-us.ahrq.gov. For additional HCUP statistics, visit HCUPnet, our interactive query system, at www.hcup.ahrq.gov. For information on other hospitalizations in the U.S., download HCUP Facts and Figures: Statistics on Hospital-based Care in the United States in 2007, located at http://www.hcup-us.ahrq.gov/reports.jsp. For a detailed description of HCUP, more information on the design of the NEDS, and methods to calculate estimates, please refer to the following publications: Steiner, C., Elixhauser, A., Schnaier, J. The Healthcare Cost and Utilization Project: An Overview. Effective Clinical Practice 2002;5(3):143–51. Introduction to the HCUP Nationwide Emergency Department Sample, 2007. Online. January, 2010. U.S. Agency for Healthcare Research and Quality. http://www.hcup-us.ahrq.gov/db/nation/neds/NEDS_2007_Introduction_v5.pdf . Houchens, R., Elixhauser, A. Final Report on Calculating Nationwide Inpatient Sample (NIS) Variances, 2001. HCUP Methods Series Report #2003-2. Online. June 2005 (revised June 6, 2005). U.S. Agency for Healthcare Research and Quality. http://www.hcup-us.ahrq.gov/reports/methods/2003_02.pdf. Suggested Citation Owens P.L., Mutter R., Stocks C. Mental Health and Substance Abuse-Related Emergency Department Visits among Adults, 2007. HCUP Statistical Brief #92. July 2010. Agency for Healthcare Research and Quality, Rockville, MD. http://www.hcup-us.ahrq.gov/reports/statbriefs/sb92.pdf. *** AHRQ welcomes questions and comments from readers of this publication who are interested in obtaining more information about access, cost, use, financing, and quality of healthcare in the United States. We also invite you to tell us how you are using this Statistical Brief and other HCUP data and tools, and to share suggestions on how HCUP products might be enhanced to further meet your needs. Please e-mail us at hcup@ahrq.gov or send a letter to the address below: Irene Fraser, Ph.D., Director Center for Delivery, Organization, and Markets Agency for Healthcare Research and Quality 540 Gaither Road Rockville, MD 20850 1 National Comorbidity Survey and National Comorbidity Survey Replication (NCS-R). Available at: www.hcp.med.harvard.edu/ncs. 2 Institute of Medicine. Committee on Crossing the Quality Chasm: Adaptation to Mental Health and Addictive Disorders. Improving the Quality of Health Care for Mental and Substance-Use Conditions. Washington, D.C.: National Academies Press. 2006. 3 Larkin, G.L., Claassen, C.A., Edmond, J.A., Pelletier, A. J., and Camargo, C.A. Trends in U.S. Emergency Department Visits for Mental Health Conditions, 1992 to 2001. Psychiatric Services. 2005;56:671–677. 4 Institute of Medicine. Hospital-Based Emergency Care at the Breaking Point. Washington, D.C.: Institute of Medicine. 2004. 5 American College of Emergency Physicians (ACEP) Psychiatric and Substance Abuse Survey 2008. Fact Sheet. Alakeson V, Pande N, Ludwig M. A plan to reduce emergency room 'boarding' of psychiatric patients. Health Affairs (Millwood). 2010 Sep;29(9):1637-42. 6 HCUP CCS. Healthcare Cost and Utilization Project (HCUP). June 2009. U.S. Agency for Healthcare Research and Quality, Rockville, MD. www.hcup-us.ahrq.gov/toolssoftware/ccs/ccs.jsp |
| Table 1: Characteristics of ED Visits Related to Mental Health and Substance Abuse Conditions among Adults, 2007 | ||||||||||
| Type of ED Visit | Type of MHSA-Related ED Visit | |||||||||
|---|---|---|---|---|---|---|---|---|---|---|
| All MHSA Related | All Other ED Visits | MH Only Related Visit | SA Only Related Visit | Co-Occurring MHSA Related Visit | ||||||
| Total ED visits in millions | 11,956,596 | 83,410,968 | 7,616,809 | 2,918,256 | 1,421,530 | |||||
| Percentages of ED Visits | 12.5% | 87.5% | 8.0% | 3.1% | 1.5% | |||||
| Percentage of all MHSA-related ED visits | — | — | 63.7% | 24.4% | 11.9% | |||||
| Percentage with First-Listed/Principal MHSA Condition1 | 4,138,992 | 34.6% | — | 2,198,128 | 28.9% | 970,445 | 33.3% | 970,419 | 68.3 | |
| Patient Characteristics | ||||||||||
| Female | 6,443,732 | 53.9% | 47,690,265 | 57.2% | 4,978,488 | 65.4% | 854,628 | 29.3% | 610,616 | 43.0% |
| Age, in years | ||||||||||
| 18–44 | 5,566,000 | 46.6% | 43,708,616 | 52.4% | 3,249,434 | 42.7% | 1,480,350 | 50.7% | 836,216 | 58.8% |
| 45–64 | 4,125,252 | 34.5% | 21,483,295 | 25.8% | 2,442,281 | 32.1% | 1,172,062 | 40.2% | 510,909 | 35.9% |
| 65+ | 2,265,344 | 18.9% | 18,219,057 | 21.8% | 1,925,094 | 25.3% | 265,845 | 9.1% | 74,405 | 5.2% |
| Primary Expected Payer2 | ||||||||||
| Medicare | 3,585,319 | 30.1% | 20,566,737 | 24.7% | 2,823,381 | 37.2% | 474,813 | 16.3% | 287,125 | 20.3% |
| Medicaid | 2,355,830 | 19.8% | 12,356,568 | 14.9% | 1,390,624 | 18.3% | 600,823 | 20.7% | 364,383 | 25.7% |
| Private | 3,064,463 | 25.7% | 28,698,305 | 34.5% | 2,088,024 | 27.5% | 645,016 | 22.2% | 331,423 | 23.4% |
| Other | 456,323 | 3.8% | 4,354,010 | 5.2% | 244,125 | 3.2% | 151,078 | 5.2% | 61,120 | 4.3% |
| Uninsured | 2,450,883 | 20.6% | 17,078,258 | 20.6% | 1,042,576 | 13.8% | 1,036,157 | 35.6% | 372,150 | 26.3% |
| Source: Agency for Healthcare Research and Quality, Healthcare Cost and Utilization Project, Nationwide Emergency Department Sample, 2007; dashes indicate that data is not applicable. Note: MH = mental health; SA = substance abuse; MHSA = mental health and substance abuse 1 Based on first-listed or principal diagnosis or all-listed external cause of injury. 2 Missing expected payer information on 400,870 ED records. | ||||||||||
| Table 2: Most Common All-Listed MHSA Conditions Seen During an ED Visit, 2007 | ||||||||||||
| Age Categories | ||||||||||||
|---|---|---|---|---|---|---|---|---|---|---|---|---|
| Overall | 18-44 Years | 45-64 Years | 65 Years and Older | |||||||||
| Any-Listed MHSA Condition | Number of ED Visits | Percent | Rank | Number of ED Visits | Percent | Rank | Number of ED Visits | Percent | Rank | Number of ED Visits | Percent | Rank |
| Mood disorders | 5,101,384 | 42.7 | 1 | 2,181,030 | 39.2 | 1 | 1,742,240 | 42.2 | 1 | 1,178,114 | 52.0 | 1 |
| Anxiety disorders | 3,124,412 | 26.1 | 1 | 1,496,888 | 26.9 | 2 | 974,556 | 23.6 | 3 | 652,968 | 28.8 | 2 |
| Alcohol-related conditions | 2,738,638 | 22.9 | 3 | 1,297,112 | 23.3 | 4 | 1,194,566 | 29.0 | 2 | 246,960 | 10.9 | 4 |
| Drug-related conditions | 2,108,081 | 17.6 | 4 | 1,329,439 | 23.9 | 3 | 676,336 | 16.4 | 4 | 102,306 | 4.5 | 5 |
| Schizophrenia and other psychoses | 1,180,445 | 9.9 | 5 | 485,056 | 8.7 | 438,121 | 10.6 | 5 | 257,268 | 11.4 | 3 | |
| Intentional self-harm | 792,939 | 6.6 | 547,015 | 9.8 | 5 | 218,744 | 5.3 | 27,180 | 1.2 | |||
| Top 5 Conditions | 11,478,986 | 96.0 | 5,096,980 | 91.6 | 4,018,696 | 97.4 | 2,207,321 | 97.4 | ||||
| Primary Expected Payer Categories | ||||||||||||
| Medicare | Medicaid | Private | Uninsured | |||||||||
| Any-Listed MHSA Condition | Number of ED Visits | Percent | Rank | Number of ED Visits | Percent | Rank | Number of ED Visits | Percent | Rank | Number of ED Visits | Percent | Rank |
| Mood disorders | 1,861,816 | 51.9 | 1 | 994,401 | 42.2 | 1 | 1,336,643 | 43.6 | 1 | 722,497 | 29.5 | 2 |
| Anxiety disorders | 926,724 | 25.8 | 2 | 550,350 | 23.4 | 3 | 999,872 | 32.6 | 2 | 531,155 | 21.7 | 4 |
| Alcohol-related conditions | 471,217 | 13.1 | 4 | 536,237 | 22.8 | 4 | 671,793 | 21.9 | 3 | 910,168 | 37.1 | 1 |
| Drug-related conditions | 362,469 | 10.1 | 5 | 572,138 | 24.3 | 2 | 397,717 | 13.0 | 4 | 669,124 | 27.3 | 3 |
| Schizophrenia and other psychoses | 557,384 | 15.5 | 3 | 308,986 | 13.1 | 5 | 127,669 | 4.2 | 144,884 | 5.9 | ||
| Intentional self-harm | 131,071 | 3.7 | 181,164 | 7.7 | 208,907 | 6.8 | 5 | 231,094 | 9.4 | 5 | ||
| Top 5 Conditions | 3,488,808 | 97.3 | 2,255,615 | 95.8 | 2,866,050 | 93.5 | 2,310,443 | 94.3 | ||||
| Source: Agency for Healthcare Research and Quality, Healthcare Cost and Utilization Project. Nationwide Emergency Department Sample, 2007 Note: Other expected payer is not included in this table. Other expected payer accounts for ‹4 percent of ED visits related to MHSA. Percentages in each column total more than 100 percent because multiple diagnoses can be listed on a record. | ||||||||||||
|
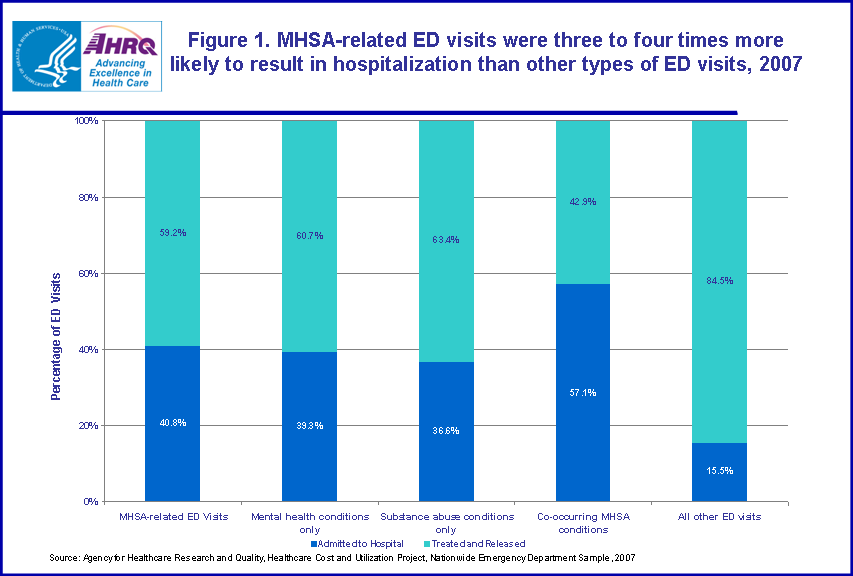
Figure 1. MHSA-related ED visits were three to four times more
likely to result in hospitalization than other types of ED visits, 2007. For MHSA related ED visits; 59.2 percent were treated and released; 40.8 percent were admitted to hospital. For mental health conditions only; 60.7 percent were treated and released; 39.3 percent were admitted to hospital. For substance abuse conditions only; 63.4 percent were treated and released; 36.6 percent were admitted to hospital. For co-occurring MHSA conditions; 42.9 percent were treated and released; 57.1 percent were admitted to hospital. For all other ED visits; 84.5 percent were treated and released; 15.5 percent were admitted to hospital. Source: Agency for Healthcare Research and Quality, Healthcare Cost and Utilization Project, Nationwide Emergency Department Sample, 2007
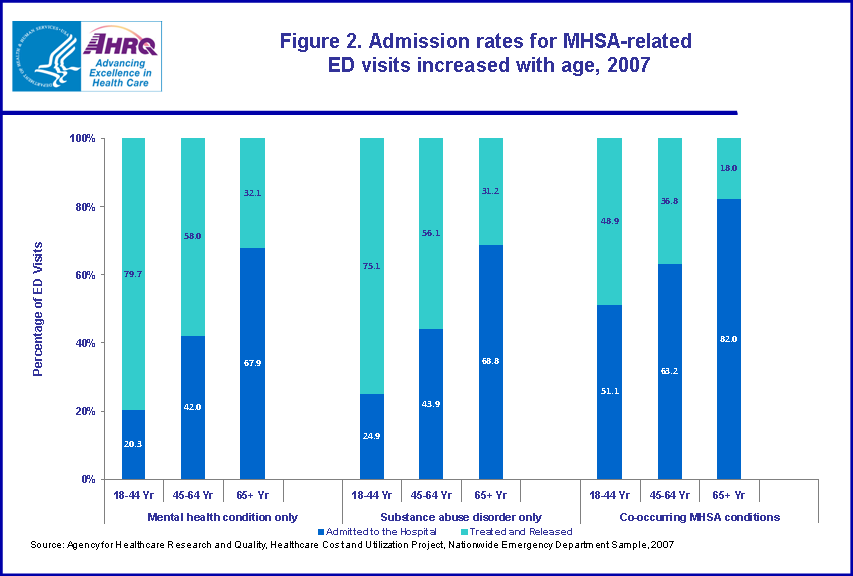
Figure 2. Admission rates for MHSA-related ED visits increased with age, 2007. For mental health conditions only, ages 18-44, 79.7 percent were treated and released; 20.3 percent were admitted to hospital. For mental health conditions only, ages 45-64, 58.0 percent were treated and released; 42.0 percent were admitted to hospital. For mental health conditions only, ages 65 plus, 32.1 percent were treated and released; 67.9 percent were admitted to hospital. For substance abuse disorder only, ages 18-44; 75.1 percent were treated and released; 24.9 percent were admitted to hospital. For substance abuse disorder only, ages 45-64; 56.1 percent were treated and released; 43.9 percent were admitted to hospital. For substance abuse disorder only, ages 65 plus; 31.2 percent were treated and released; 68.8 percent were admitted to hospital. For co-occurring MHSA conditions, ages 18-44; 48.9 percent were treated and released; 51.1 percent were admitted to hospital. For co-occurring MHSA conditions, ages 45-64; 36.8 percent were treated and released; 63.2 percent were admitted to hospital. For co-occurring MHSA conditions, ages 65 plus; 18.0 percent were treated and released; 82.0 percent were admitted to hospital. Source: Agency for Healthcare Research and Quality, Healthcare Cost and Utilization Project, Nationwide Emergency Department Sample, 2007.
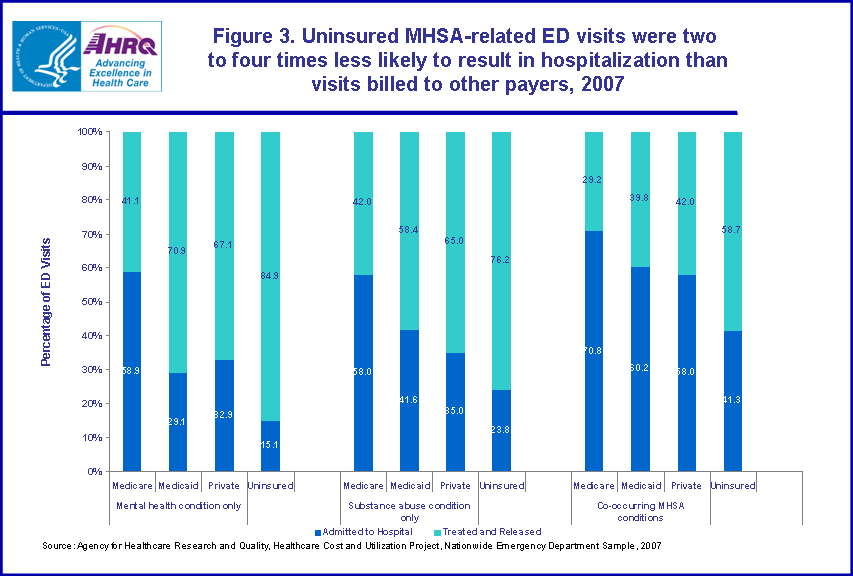
Figure 3. Uninsured MHSA-related ED visits were two to four times less likely to result in hospitalization than visits billed to other payers, 2007. For mental health conditions only, Medicare, 41.1 percent were treated and released; 58.9 percent were admitted to hospital. For mental health conditions only, Medicaid, 70.9 percent were treated and released; 29.1 percent were admitted to hospital. For mental health conditions only, Private, 67.1 percent were treated and released; 32.9 percent were admitted to hospital. For mental health conditions only, Uninsured, 84.9 percent were treated and released; 15.1 percent were admitted to hospital.
For substance abuse disorder only, Medicare; 42.0 percent were treated and released; 58.0 percent were admitted to hospital. For substance abuse disorder only, Medicaid; 58.4 percent were treated and released; 41.6 percent were admitted to hospital. For substance abuse disorder only, Private; 65.0 percent were treated and released; 35.0 percent were admitted to hospital. For substance abuse disorder only, Uninsured; 76.2 percent were treated and released; 23.8 percent were admitted to hospital.
For co-occurring MHSA conditions, Medicare; 29.2 percent were treated and released; 70.8 percent were admitted to hospital. For co-occurring MHSA conditions, Medicaid; 39.8 percent were treated and released; 60.2 percent were admitted to hospital. For co-occurring MHSA conditions, Private; 42.0 percent were treated and released; 58.0 percent were admitted to hospital. For co-occurring MHSA conditions, Uninsured; 58.7 percent were treated and released; 41.3 percent were admitted to hospital. Source: Agency for Healthcare Research and Quality, Healthcare Cost and Utilization Project, Nationwide Emergency Department Sample, 2007.
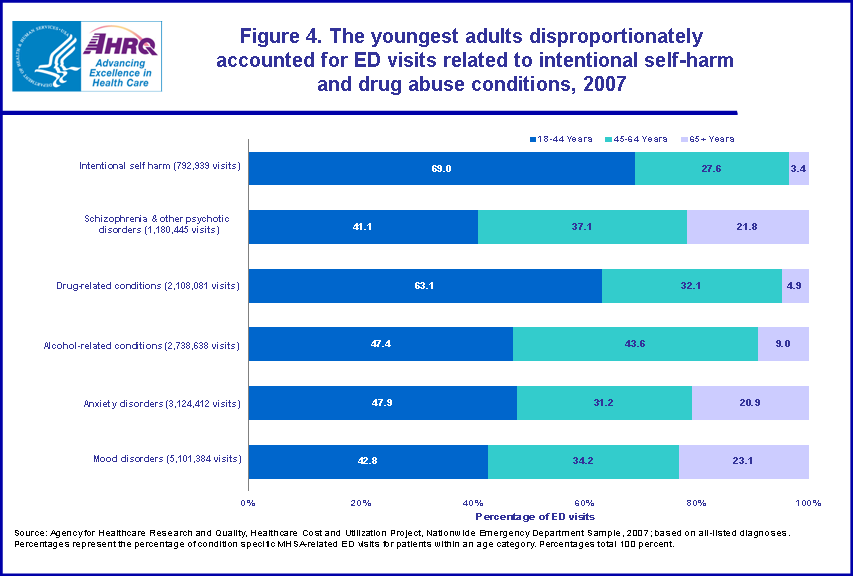
Figure 4. The youngest adults disproportionately accounted for ED visits related to intentional self-harm and drug abuse conditions, 2007. Percentage of ED visits per age category related to intentional self harm (792,939 visits); 69.0 percent, 18-44 years; 27.6 percent, 45-64 years; 3.4 percent, 65 plus years. Percentage of ED visits per age category related to schizophrenia and other psychotic disorders (1,180,445 visits); 41.1 percent, 18-44 years; 37.1 percent, 45-64 years; 21.8 percent, 65 plus years. Percentage of ED visits per age category related to drug related conditions (2,108,081 visits); 63.1 percent, 18-44 years; 32.1 percent, 45-64 years; 4.9 percent, 65 plus years. Percentage of ED visits per age category related to alcohol related conditions (2,738,638 visits); 47.4 percent, 18-44 years; 43.6 percent, 45-64 years; 9.0 percent, 65 plus years. Percentage of ED visits per age category related to anxiety disorders (3,124,412 visits); 47.9 percent, 18-44 years; 31.2 percent, 45-64 years; 20.9 percent, 65 plus years. Percentage of ED visits per age category related to mood disorders (5,101,384 visits); 42.8 percent, 18-44 years; 34.2 percent, 45-64 years; 23.1percent, 65 plus years. Source: Agency for Healthcare Research and Quality, Healthcare Cost and Utilization Project, Nationwide Emergency Department Sample, 2007; based on all-listed diagnoses. Percentages represent the percentage of condition specific MHSA-related ED visits for patients within an age category. Percentages total 100 percent.
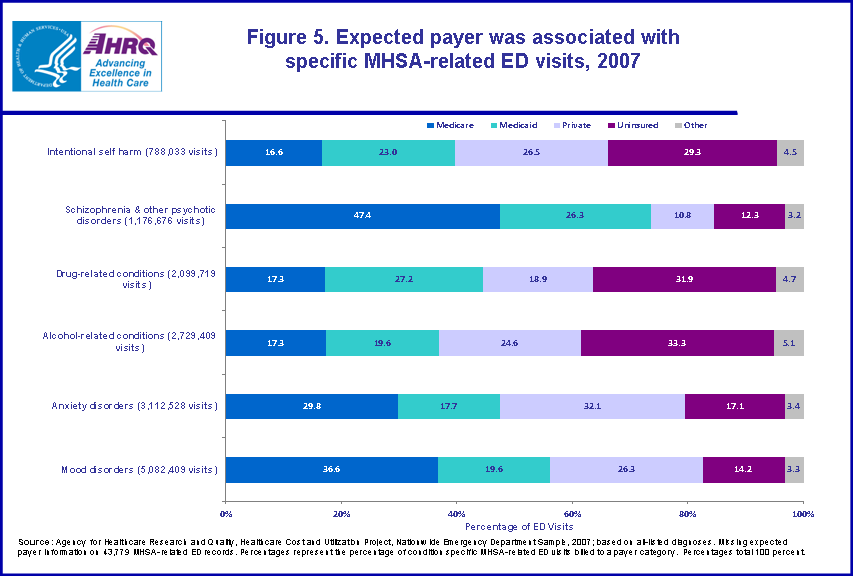
Figure 5. Expected payer was associated with specific MHSA-related ED visits, 2007. Percentage of ED visits per insurance category related to intentional self harm (788,033 visits); 16.6 percent, Medicare; 23.0 percent, Medicaid; 26.5 percent, Private; 29.3 percent, Uninsured; 4.5 percent, Other. Percentage of ED visits per insurance category related to schizophrenia and other psychotic disorders (1,176,676 visits); 47.4 percent, Medicare; 26.3 percent, Medicaid; 10.8 percent, Private; 12.3 percent, Uninsured; 3.2 percent, Other. Percentage of ED visits per insurance category related to drug related conditions (2,099,719 visits); 17.3 percent, Medicare; 27.2 percent, Medicaid; 18.9 percent, Private; 31.9 percent, Uninsured; 4.7 percent, Other. Percentage of ED visits per insurance category related to alcohol related conditions (2,729,409 visits); 17.3 percent, Medicare; 19.6 percent, Medicaid; 24.6 percent, Private; 33.3 percent, Uninsured; 5.1 percent, Other. Percentage of ED visits per insurance category related to anxiety disorders (3,112,528 visits); 29.8 percent, Medicare; 17.7 percent, Medicaid; 32.1 percent, Private; 17.1 percent, Uninsured; 3.4 percent, Other. Percentage of ED visits per insurance category related to mood disorders (5,082,409 visits); 36.6 percent, Medicare; 19.6 percent, Medicaid; 26.3 percent, Private; 14.2 percent, Uninsured; 3.3 percent, Other. Source: Agency for Healthcare Research and Quality, Healthcare Cost and Utilization Project, Nationwide Emergency Department Sample, 2007; based on all-listed diagnoses. Missing expected payer information on 43,779 MHSA-related ED records. Percentages represent the percentage of condition specific MHSA-related ED visits billed to a payer category. Percentages total 100 percent.
|