TABLE OF CONTENTS
HIGHLIGHTS
INTRODUCTION
HCUP PARTNERS
1. OVERVIEW
2. DIAGNOSES
3. PROCEDURES
4. COSTS
5. PAYERS
SOURCES/METHODS
DEFINITIONS
FOR MORE INFO
ACKNOWLEDGMENTS
CITATION
FACTS & FIGURES 2007 PDF
|
EXHIBIT 4.1 Cost by Body System PDF
Aggregate Costs by Principal CCS Body System and Condition Category, 1997, 2002, and 2007
| PRINCIPAL CCS BODY SYSTEM AND CONDITION CATEGORY |
TOTAL INFLATION-ADJUSTED† HOSPITAL COSTS IN BILLIONS: 2007 DOLLARS |
PERCENT OF TOTAL COSTS |
AVERAGE ANNUAL GROWTH |
| 1997 |
2002 |
2007 |
1997 |
2002 |
2007 |
1997-2007 |
| All body systems and condition categories |
$222.4 |
$298.5 |
$343.9 |
100.0% |
100.0% |
100.0% |
4.5% |
| Circulatory |
57.1 |
74.3 |
74.6‡ |
25.7 |
24.9 |
21.7 |
2.7 |
| Injury and poisoning |
23.0 |
31.0 |
37.2 |
10.4 |
10.4 |
10.8 |
4.9 |
| Digestive |
20.8 |
29.0 |
32.0 |
9.4 |
9.7 |
9.3 |
4.4 |
| Respiratory |
22.7 |
28.7 |
31.1 |
10.2 |
9.6 |
9.0 |
3.2 |
| Neoplasms |
19.3 |
24.2 |
28.2‡ |
8.7 |
8.1 |
8.2 |
3.9 |
| Musculoskeletal |
11.8 |
18.6 |
26.8 |
5.3 |
6.2 |
7.8 |
8.5 |
| Pregnancy and childbirth |
12.2 |
16.1 |
18.8 |
5.5 |
5.4 |
5.5 |
4.4 |
| Perinatal (newborns) |
9.7 |
11.8 |
15.5 |
4.4 |
4.0 |
4.5 |
4.8 |
| Infectious and parasitic |
6.6 |
7.9 |
15.3 |
3.0 |
2.6 |
4.4 |
8.8 |
| Genitourinary |
8.1 |
11.0 |
13.5 |
3.6 |
3.7 |
3.9 |
5.3 |
| Mental |
7.9 |
11.7 |
12.2‡ |
3.6 |
3.9 |
3.5 |
4.4 |
| Endocrine |
5.8 |
9.4 |
10.0‡ |
2.6 |
3.1 |
2.9 |
5.6 |
| Symptoms |
6.9 |
9.5 |
9.5‡ |
3.1 |
3.2 |
2.8 |
3.2 |
| Nervous |
3.9 |
5.7 |
6.7 |
1.8 |
1.9 |
2.0 |
5.6 |
| Skin |
2.4 |
3.6 |
4.8 |
1.1 |
1.2 |
1.4 |
7.2 |
| Blood |
1.8 |
2.9 |
3.5 |
0.8 |
1.0 |
1.0 |
6.7 |
| Congenital |
2.0 |
2.6‡ |
2.8‡ |
0.9 |
0.9 |
0.8 |
3.5 |
† Adjusted for inflation using the GDP deflator (http://www.bea.gov/national/nipaweb/SelectTable.asp, Table 1.1.4. Price Indexes for Gross Domestic Product).
‡ Costs are not statistically different from previously reported year shown on table at p‹0.05.
Note: Aggregate costs for residual codes and those not elsewhere classified are not shown here. As a result, aggregate costs for all body systems may be larger than the sum of the component parts.
Source: AHRQ, Center for Delivery, Organization, and Markets, Healthcare Cost and Utilization Project, Nationwide Inpatient Sample, 1997, 2002, and 2007. |
Inflation-adjusted aggregate costs for community hospital stays rose from $222.4 billion in 1997 to $343.9 billion in 2007.
- Hospital stays for circulatory conditions accounted for the largest share of costs in 1997 (26 percent, $57.1 billion) and 2007 (22 percent, $74.6 billion). Most of the increase in costs for circulatory conditions occurred between 1997 and 2002; there was little measureable increase between 2002 and 2007.
- Injury and poisoning was the second most expensive condition in 2007. Stays cost $37.2 billion (11 percent of aggregate costs) in 2007 and grew 4.9 percent annually from 1997 to 2007.
- Digestive conditions and respiratory conditions were each responsible for one-tenth of the aggregate costs in both 1997 and 2007.
- The fastest increase in costs was for infectious and parasitic diseases, which grew by 8.8 percent per year from 1997 to 2007.
- A close second in cost increases was musculoskeletal diseases, which grew 8.5 percent annually.

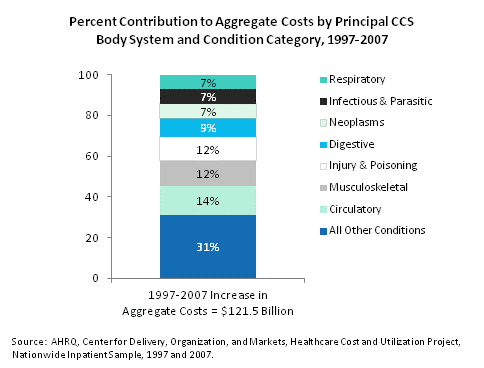
Percent contribution to aggregate costs by principal CCS body system and condition category, 1997 through 2007. Column chart. Respiratory: 7%; infectious and parasitic: 7%; neoplasms: 7%; digestive: 9%; injury and poisoning: 12%; musculoskeletal: 12%; circulatory: 14%; all other conditions: 31%. 1997 through 2007 increase in aggregate costs equals $121.5 billion.
Two body system and condition categories (musculoskeletal and infectious and parasitic conditions) contributed substantially more to the increase in costs between 1997 and 2007 than their share of overall 2007 costs would suggest—an indication of their rapid growth.
- Costs for hospitalizations for infectious and parasitic conditions amounted to $15.3 billion in 2007, 4.4 percent of aggregate costs. Costs more than doubled between 1997 ($6.6 billion) and 2007 ($15.3 billion) and were responsible for 7 percent of the increase in aggregate hospitalization costs.
- Costs for stays for musculoskeletal conditions increased by $15 billion and were responsible for more than 12 percent of the total cost increase. These costs more than doubled, from $11.8 billion to $26.8 billion, between 1997 and 2007. By 2007, costs for stays for musculoskeletal conditions accounted for 8 percent of all costs, up from a 5 percent share in 1997.

(text version)
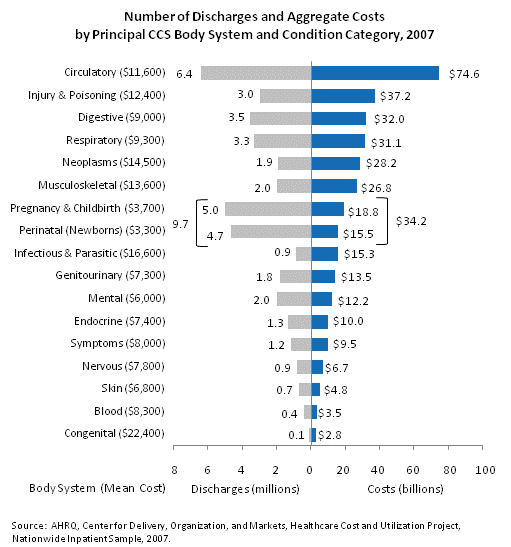
Aggregate costs and the number of discharges varied widely across body system and condition categories.
- In 2007, circulatory conditions, which accounted for the highest aggregate costs across all body systems, also accounted for the greatest number of discharges. On average, these hospitalizations cost $11,600.
- Injury and poisoning was, in aggregate, the second most expensive condition type in 2007 and the sixth most common reason for a hospital stay. Hospital stays for injury and poisoning cost an average of $12,400.
- Conditions related to pregnancy and childbirth and perinatal (newborn) conditions were the second and third most frequent reasons for hospitalizations. The average hospital cost for these conditions ($3,700 for pregnancy and childbirth and $3,300 for perinatal (newborn) conditions) was less than that for any other type of condition, making the aggregate costs—$18.8 billion and $15.5 billion, respectively—relatively low, despite the high volume of these conditions.
- Combined, hospital stays related to pregnancy, childbirth, and newborns accounted for the most stays (9.7 million) and $34.2 billion in costs.
- Infectious and parasitic conditions accounted for just under 1 million hospital stays; these stays cost $15.3 billion, or an average of $16,600 per hospitalization—the second highest average cost for a hospitalization.
- Hospital stays for congenital anomalies cost an average of $22,400 in 2007—the highest average cost per stay of any body system or condition type. Because hospital stays for these conditions are relatively infrequent—there were just 124,100 of these stays in 2007—the aggregate cost was the lowest of any body system or condition type.
Previous Next
|