STATISTICAL BRIEF #153 |
April 2013
Anne Elixhauser, Ph.D. and Claudia Steiner, M.D., M.P.H. Introduction The problem of readmissions to the hospital is receiving increased attention as a potential way to address problems in quality of care, cost of care, and care transitions.1,2 Medicare reports 30-day hospital readmissions for acute myocardial infarction, congestive failure, and pneumonia for individual hospitals across the country.3 Interventions are underway to reduce hospital readmissions at the state and national level.4,5 Prior research reports have focused on readmissions for specific conditions such as congestive heart failure, pneumonia, chronic obstructive pulmonary disease (COPD), and psychoses.6,7,8 This Statistical Brief provides an overview of 30-day all-payer, all-cause readmissions to U.S. hospitals for a range of conditions in 2010, thereby presenting the most comprehensive national estimates on readmissions by condition. In this Statistical Brief, readmission was defined as a subsequent hospital admission within 30 days following an original admission (or index stay) that occurred from January through November 2010. All-cause readmissions were examined; thus, readmissions may or may not include conditions that were listed as the principal diagnosis during the index stay. Readmissions were tracked across the same or different hospitals. Some readmissions may be planned or unavoidable-no attempt was made to remove these types of readmissions from the analysis. Readmission rates using Healthcare Cost and Utilization Project (HCUP) data are presented for the most frequently treated conditions in U.S. hospitals during 2010 and for the conditions with the highest readmission rates. All estimates were taken from HCUPnet, the online query system that provides free access to information from HCUP.9 For a subset of conditions, readmission rates are presented by age group and expected payer (insurance status). Patients younger than 1 year were excluded from this analysis. Readmission rates were calculated without risk adjustment. Appendix A provides detailed information on readmission rates for most conditions treated in U.S. hospitals in 2010. The table provides information on the number of index stays for each condition, the number of all-cause readmissions within 30 days, and the percentage of index stays that were followed by a readmission within 30 days for any cause. Excluded were nonspecific conditions and any conditions with fewer than 5,000 index stays or fewer than 500 readmissions. Conditions are organized by etiology or body system. |
|
Findings
Readmission rates for the most frequently treated conditions Table 1 lists the 30 most frequently treated conditions in U.S. hospitals, with their 30-day readmission rates. The most frequent conditions and their readmission rates were pneumonia (15.7 percent), mood disorders (14.8 percent), osteoarthritis (4.8 percent), congestive heart failure (24.7 percent), and cardiac dysrhythmias (14.8 percent). Among these most frequent conditions, the highest readmission rates were seen for congestive heart failure (24.7 percent), schizophrenia (22.3 percent), and acute and unspecified renal failure (21.7 percent). In other words, for these conditions over one in five patients were readmitted to the hospital within 30 days. The lowest readmission rates were for childbirth-related procedures (trauma to perineum and vulva during childbirth, 0.8 percent; C-section, 1.5 percent), osteoarthritis (4.8 percent), and appendicitis (4.9 percent). Conditions with the highest readmission rates Table 2 lists conditions ranked by the highest readmission rates. Because cancer readmissions are often planned, cancer is excluded from this table (although cancer-related conditions are included in the Appendix). The five conditions with the highest readmission rates were sickle cell anemia (31.9 percent), gangrene (31.6 percent), hepatitis (30.9 percent), diseases of the white blood cells (30.9 percent), and chronic renal failure (27.4 percent). In other words, over one in four patients were readmitted to the hospital within 30 days for these conditions. Readmission rates by age and insurance status for selected conditions Figures 1-5 provide details on 30-day all-cause readmission rates for the five conditions from Table 2 that involved more than 300,000 index stays and had overall readmission rates of at least 20 percent.10 |
| Table 1. All-cause 30-day readmissions ranked by the most frequently treated conditions* in U.S. hospitals, 2010 | ||||
| Rank | Principal diagnosis for index hospital stay ** | Number of index stays | 30-day all-cause readmissions | |
|---|---|---|---|---|
| Number of readmissions | Percent readmitted | |||
| 1 | Pneumonia | 924,160 | 144,894 | 15.7 |
| 2 | Mood disorders | 883,245 | 131,125 | 14.8 |
| 3 | Osteoarthritis | 872,661 | 42,241 | 4.8 |
| 4 | Congestive heart failure, nonhypertensive | 847,073 | 209,017 | 24.7 |
| 5 | Cardiac dysrhythmias | 705,616 | 104,607 | 14.8 |
| 6 | Septicemia (except in labor) | 696,122 | 145,896 | 21.0 |
| 7 | Coronary atherosclerosis | 666,897 | 90,147 | 13.5 |
| 8 | Trauma to perineum and vulva due to childbirth | 610,073 | 5,046 | 0.8 |
| 9 | Chronic obstructive pulmonary disease and bronchiectasis | 606,186 | 126,443 | 20.9 |
| 10 | Nonspecific chest pain | 601,899 | 61,465 | 10.2 |
| 11 | Complication of device, implant or graft | 596,062 | 121,036 | 20.3 |
| 12 | Spondylosis, intervertebral disc disorders, other back problems | 579,103 | 47,774 | 8.2 |
| 13 | Skin and subcutaneous tissue infections | 576,902 | 64,680 | 11.2 |
| 14 | Urinary tract infections | 522,921 | 84,858 | 16.2 |
| 15 | Acute myocardial infarction | 520,901 | 85,932 | 16.5 |
| 16 | Acute cerebrovascular disease | 520,793 | 71,174 | 13.7 |
| 17 | Diabetes mellitus with complications | 480,958 | 97,784 | 20.3 |
| 18 | Previous C-section | 462,378 | 7,046 | 1.5 |
| 19 | Complications of surgical procedures or medical care | 453,266 | 81,353 | 17.9 |
| 20 | Biliary tract disease | 430,988 | 48,062 | 11.2 |
| 21 | Schizophrenia and other psychotic disorders | 397,166 | 88,629 | 22.3 |
| 22 | Fluid and electrolyte disorders | 396,551 | 73,721 | 18.6 |
| 23 | Asthma | 347,404 | 41,320 | 11.9 |
| 24 | Acute and unspecified renal failure | 326,586 | 70,756 | 21.7 |
| 25 | Gastrointestinal hemorrhage | 320,613 | 54,154 | 16.9 |
| 26 | Intestinal obstruction without hernia | 315,128 | 51,135 | 16.2 |
| 27 | Fracture of neck of femur (hip) | 291,847 | 38,668 | 13.2 |
| 28 | Diverticulosis and diverticulitis | 289,097 | 35,461 | 12.3 |
| 29 | Pancreatic disorders (not diabetes) | 282,159 | 49,936 | 17.7 |
| 30 | Appendicitis and other appendiceal conditions | 262,024 | 12,875 | 4.9 |
| Source: Weighted national estimates from a readmissions analysis file derived from the Healthcare Cost and Utilization Project (HCUP) State Inpatient Databases (SID), 2010, Agency for Healthcare Research and Quality (AHRQ). * Information is provided for diagnoses with 5,000 or more weighted index stays and 500 or more weighted readmissions. See text and Definitions for details on methods for calculating readmissions. ** Clinical Classification Software (CCS) label. Excludes cancers and nonspecific CCS categories. |
||||
| Table 2. All-cause 30-day readmissions ranked by conditions with the highest readmission rates,* U.S. hospitals, 2010 | ||||
| Rank | Principal diagnosis for index hospital stay ** | Number of index stays | 30-day all-cause readmissions | |
|---|---|---|---|---|
| Number of readmissions | Percent readmitted | |||
| 1 | Sickle cell anemia | 87,326 | 27,837 | 31.9 |
| 2 | Gangrene | 33,786 | 10,693 | 31.6 |
| 3 | Hepatitis | 37,480 | 11,593 | 30.9 |
| 4 | Disease of white blood cells | 54,861 | 16,771 | 30.6 |
| 5 | Chronic renal failure | 17,394 | 4,766 | 27.4 |
| 6 | Systemic lupus erythematosus and connective tissue disorders | 18,850 | 5,123 | 27.2 |
| 7 | Mycoses | 23,026 | 6,222 | 27.0 |
| 8 | HIV infection | 34,958 | 9,230 | 26.4 |
| 9 | Screening and history of mental health and substance abuse | 60,417 | 15,695 | 26.0 |
| 10 | Peritonitis and intestinal abscess | 25,219 | 6,315 | 25.0 |
| 11 | Congestive heart failure, nonhypertensive | 847,073 | 209,017 | 24.7 |
| 12 | Personality disorders | 5,436 | 1,316 | 24.2 |
| 13 | Nutritional deficiencies | 9,845 | 2,355 | 23.9 |
| 14 | Coagulation and hemorrhagic disorders | 33,397 | 7,920 | 23.7 |
| 15 | Respiratory failure, insufficiency, arrest (adult) | 260,781 | 59,842 | 22.9 |
| 16 | Nausea and vomiting | 51,833 | 11,854 | 22.9 |
| 17 | Schizophrenia and other psychotic disorders | 397,166 | 88,629 | 22.3 |
| 18 | Acute and unspecified renal failure | 326,586 | 70,756 | 21.7 |
| 19 | Aspiration pneumonitis, food/vomitus | 147,837 | 31,772 | 21.5 |
| 20 | Hypertension with complications and secondary hypertension | 211,243 | 45,309 | 21.4 |
| 21 | Chronic ulcer of skin | 50,845 | 10,823 | 21.3 |
| 22 | Pleurisy, pneumothorax, pulmonary collapse | 101,298 | 21,485 | 21.2 |
| 23 | Early or threatened labor | 179,175 | 37,797 | 21.1 |
| 24 | Septicemia | 696,122 | 145,896 | 21.0 |
| 25 | Anemia | 203,098 | 42,374 | 20.9 |
| 26 | Chronic obstructive pulmonary disease and bronchiectasis | 606,186 | 126,443 | 20.9 |
| 27 | Aortic and peripheral arterial embolism or thrombosis | 26,104 | 5,381 | 20.6 |
| 28 | Heart valve disorders | 100,327 | 20,613 | 20.5 |
| 29 | Diabetes mellitus with complications | 480,958 | 97,784 | 20.3 |
| 30 | Complication of device, implant or graft | 596,062 | 121,036 | 20.3 |
| Source: Weighted national estimates from a readmissions analysis file derived from Healthcare Cost and Utilization Project (HCUP) State Inpatient Databases (SID), 2010, Agency for Healthcare Research and Quality (AHRQ). * Information is provided for diagnoses with 5,000 or more weighted index stays and 500 or more weighted readmissions. See text and Definitions for details on methods for calculating readmissions. ** Clinical Classification Software (CCS) label. Excludes cancers and nonspecific CCS categories. |
||||
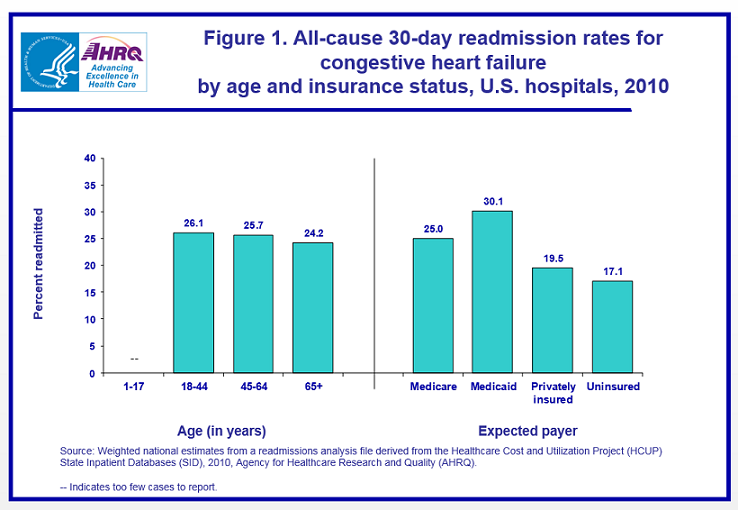
Figure 1 shows that readmission rates for congestive heart failure were relatively uniform across age groups, ranging from 24.2 percent to 26.1 percent. The highest readmission rate was seen for patients with an expected payer of Medicaid (30.1 percent) compared to 25.0 percent for Medicare-covered patients, 19.5 percent for privately insured patients, and 17.1 percent for the uninsured.
|
|
Figure 1. All-cause 30-day readmission rates for congestive heart failure by age and insurance status, U.S. hospitals, 2010. This is a bar chart showing percent readmitted by age in years and by expected payer. Ages 1 through 17, too few cases to report. Ages 18 through 44, 26.1 percent. Ages 45 through 64, 25.7 percent. Ages 65 and older, 24.2 percent. Medicare payer, 25.0 percent. Medicaid payer, 30.1 percent. Privately insured, 19.5 percent. Uninsured, 17.1 percent. Source: Weighted national estimates from a readmissions analysis file derived from the Healthcare Cost and Utilization Project State Inpatient Databases, 2010, Agency for Healthcare Research and Quality.
|
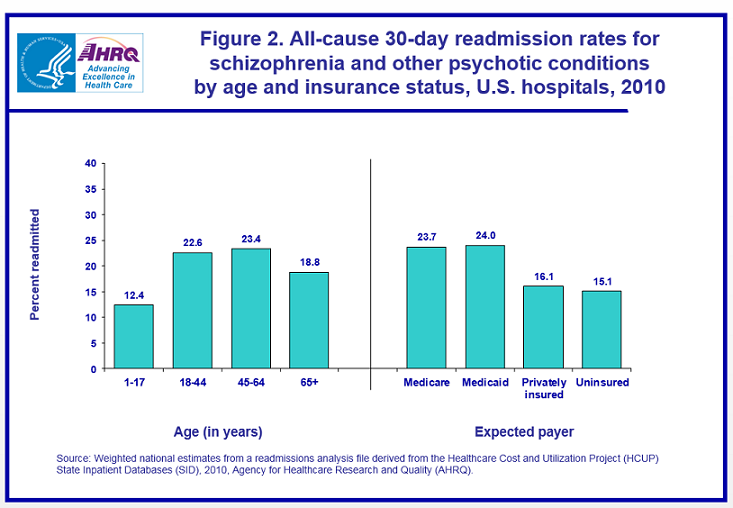
Readmission rates for schizophrenia are shown in figure 2. The highest readmission rates were seen for patients aged 18-44 years (22.6 percent) and 45-64 years (23.4 percent). Readmission rates for patients with an expected payer of Medicare (23.7 percent) and Medicaid (24.0 percent) were about 50 percent higher than for other patients (15.1-16.1 percent). |
|
Figure 2. All-cause 30-day readmission rates for schizophrenia and other psychotic conditions by age and insurance status, U.S. hospitals, 2010. This is a bar chart showing percent readmitted by age in years and by expected payer. Ages 1 through 17, 12.4 percent. Ages 18 through 44, 22.6 percent. Ages 45 through 64, 23.4 percent. Ages 65 and older, 18.8 percent. Medicare payer, 23.7 percent. Medicaid payer, 24.0 percent. Privately insured, 16.1 percent. Uninsured, 15.1 percent. Source: Weighted national estimates from a readmissions analysis file derived from the Healthcare Cost and Utilization Project State Inpatient Databases, 2010, Agency for Healthcare Research and Quality.
|
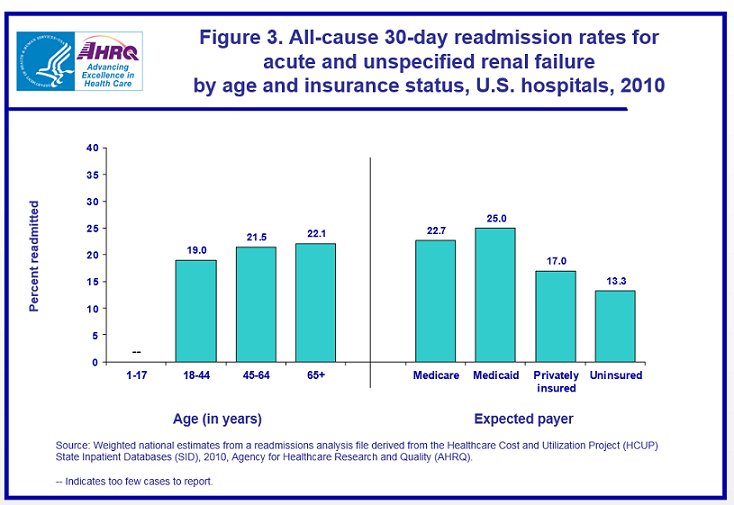
Readmission rates for acute and unspecified renal failure are depicted in figure 3. Readmission rates were similar for all adult age groups (19.0-22.1 percent), but again were substantially higher for patients with an expected payer of Medicare (22.7 percent) or covered by Medicaid (25.0 percent) than for other patients (13.3-17.0 percent). |
|
Figure 3. All-cause 30-day readmission rates for acute and unspecified renal failure by age and insurance status, U.S. hospitals, 2010. This is a bar chart showing percent readmitted by age in years and by expected payer. Ages 1 through 17, too few cases to report. Ages 18 through 44, 19.0 percent. Ages 45 through 64, 21.5 percent. Ages 65 and older, 22.1 percent. Medicare payer, 22.7 percent. Medicaid payer, 25.0 percent. Privately insured, 17.0 percent. Uninsured, 13.3 percent. Source: Weighted national estimates from a readmissions analysis file derived from the Healthcare Cost and Utilization Project State Inpatient Databases, 2010, Agency for Healthcare Research and Quality.
|
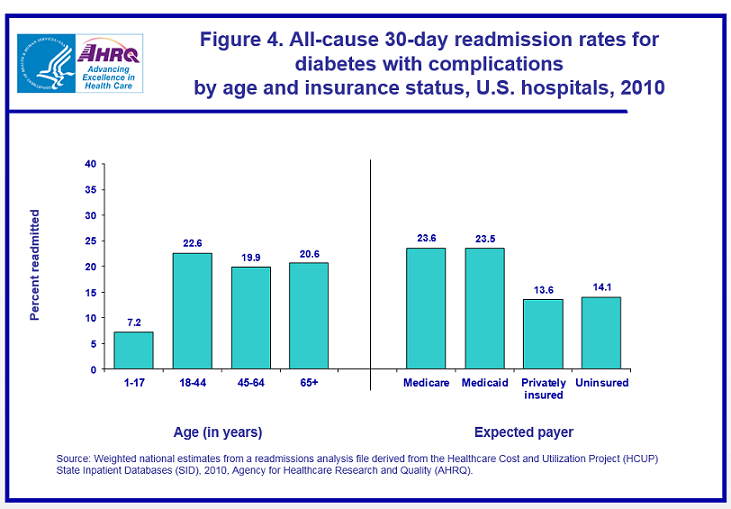
Figure 4 shows readmission rates for diabetes mellitus with complications. The highest readmission rate was for patients aged 18-44 years (22.6 percent), followed closely by patients aged 65 years and older (20.6 percent) and 45-64 years (19.9 percent). Readmission rates were nearly identical for patients covered by Medicare (23.6 percent) and Medicaid (23.5 percent); these rates were about 70 percent higher than rates for the privately insured and uninsured (13.6-14.1 percent). |
|
Figure 4. All-cause 30-day readmission rates for diabetes with complications by age and insurance status, U.S. hospitals, 2010. This is a bar chart showing percent readmitted by age in years and by expected payer. Ages 1 through 17, 7.2 percent. Ages 18 through 44, 22.6 percent. Ages 45 through 64, 19.9 percent. Ages 65 and older, 20.6 percent. Medicare payer, 23.6 percent. Medicaid payer, 23.5 percent. Privately insured, 13.6 percent. Uninsured, 14.1 percent. Source: Weighted national estimates from a readmissions analysis file derived from the Healthcare Cost and Utilization Project State Inpatient Databases, 2010, Agency for Healthcare Research and Quality.
|
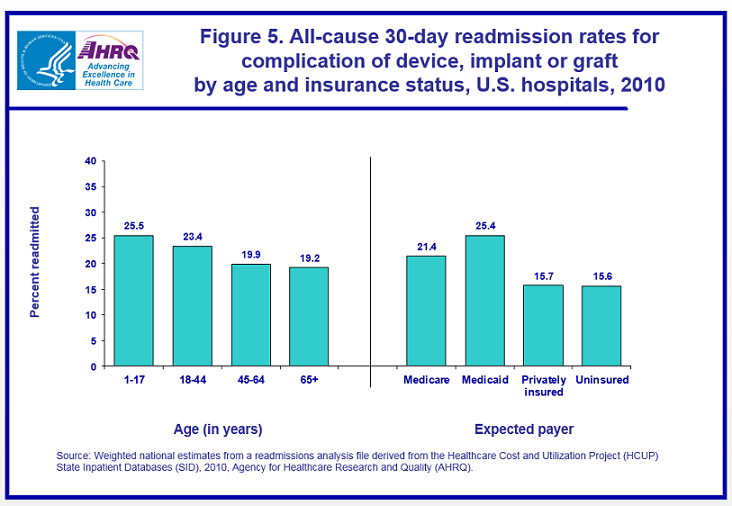
Finally, figure 5 depicts readmission rates for patients with an index stay during which their principal diagnosis was complication of device, implant, or graft. The highest readmission rate was for children aged 1-17 years (25.5 percent). Similarly, the readmission rate for Medicaid-covered patients was 25.4 percent; this rate was nearly 20 percent higher than rates for Medicare (21.4 percent) and over 60 percent higher than those for privately insured and uninsured patients (15.6-15.7 percent). |
|
Figure 5. All-cause 30-day readmission rates for complication of device, implant, or graft by age and insurance status, U.S. hospitals, 2010. This is a bar chart showing percent readmitted by age in years and by expected payer. Ages 1 through 17, 25.5 percent. Ages 18 through 44, 23.4 percent. Ages 45 through 64, 19.9 percent. Ages 65 and older, 19.2 percent. Medicare payer, 21.4 percent. Medicaid payer, 25.4 percent. Privately insured, 15.7 percent. Uninsured, 15.6 percent. Source: Weighted national estimates from a readmissions analysis file derived from the Healthcare Cost and Utilization Project State Inpatient Databases, 2010, Agency for Healthcare Research and Quality.
|
| Appendix. All-cause 30-day readmissions and costs for selected diagnoses,* U.S. hospitals, 2010 | ||||
| Principal diagnosis for index hospital stay (Clinical Classification Software [CCS] diagnosis category number and label) | Number of index stays | 30-day all-cause readmissions | ||
|---|---|---|---|---|
| Number of readmissions | Percent readmitted | |||
| Infectious and Parasitic Diseases | ||||
| 1 | Tuberculosis | 5,064 | 653 | 12.9 |
| 2 | Septicemia (except in labor) | 696,122 | 145,896 | 21.0 |
| 3 | Bacterial infection, unspecified site | 5,654 | 721 | 12.8 |
| 4 | Mycoses | 23,026 | 6,222 | 27.0 |
| 5 | HIV infection | 34,958 | 9,230 | 26.4 |
| 6 | Hepatitis | 37,480 | 11,593 | 30.9 |
| 7 | Viral infections | 56,477 | 5,849 | 10.4 |
| 10 | Immunizations and screening for infectious diseases | 7,128 | 1,034 | 14.5 |
| Neoplasms | ||||
| 11 | Cancer of head and neck | 28,530 | 6,020 | 21.1 |
| 12 | Cancer of esophagus | 11,054 | 3,170 | 28.7 |
| 13 | Cancer of stomach | 19,528 | 5,111 | 26.2 |
| 14 | Cancer of colon | 89,183 | 14,388 | 16.1 |
| 15 | Cancer of rectum and anus | 39,395 | 8,090 | 20.5 |
| 16 | Cancer of liver and intrahepatic bile duct | 17,980 | 5,077 | 28.2 |
| 17 | Cancer of pancreas | 31,054 | 8,512 | 27.4 |
| 18 | Cancer of other GI organs, peritoneum | 18,461 | 4,379 | 23.7 |
| 19 | Cancer of bronchus, lung | 117,172 | 24,893 | 21.2 |
| 21 | Cancer of bone and connective tissue | 12,242 | 3,307 | 27.0 |
| 24 | Cancer of breast | 76,838 | 6,120 | 8.0 |
| 25 | Cancer of uterus | 35,278 | 3,923 | 11.1 |
| 26 | Cancer of cervix | 16,090 | 2,457 | 15.3 |
| 27 | Cancer of ovary | 22,064 | 4,753 | 21.5 |
| 28 | Cancer of other female genital organs | 6,132 | 1,025 | 16.7 |
| 29 | Cancer of prostate | 82,794 | 5,016 | 6.1 |
| 32 | Cancer of bladder | 30,244 | 6,465 | 21.4 |
| 33 | Cancer of kidney and renal pelvis | 42,028 | 5,074 | 12.1 |
| 35 | Cancer of brain and nervous system | 32,382 | 6,649 | 20.5 |
| 36 | Cancer of thyroid | 22,335 | 1,494 | 6.7 |
| 38 | Non-Hodgkin's lymphoma | 34,769 | 12,712 | 36.6 |
| 39 | Leukemias | 31,157 | 13,008 | 41.8 |
| 40 | Multiple myeloma | 15,427 | 4,381 | 28.4 |
| 41 | Cancer, other primary | 6,146 | 1,781 | 29.0 |
| 42 | Secondary malignancies | 177,796 | 44,647 | 25.1 |
| 43 | Malignant neoplasm without specification of site | 6,636 | 1,670 | 25.2 |
| Neoplasms of unspecified nature or uncertain behavior | 42,002 | 9,551 | 22.7 | |
| 45 | Maintenance chemotherapy, radiotherapy | 126,113 | 82,601 | 65.5 |
| 46 | Benign neoplasm of uterus | 156,836 | 6,186 | 3.9 |
| Endocrine, Nutritional, and Metabolic Diseases and Immunity Disorders | ||||
| 48 | Thyroid disorders | 40,936 | 3,072 | 7.5 |
| 49 | Diabetes mellitus without complication | 20,776 | 1,776 | 8.5 |
| 50 | Diabetes mellitus with complications | 480,958 | 97,784 | 20.3 |
| 52 | Nutritional deficiencies | 9,845 | 2,355 | 23.9 |
| 54 | Gout and other crystal arthropathies | 17,506 | 2,710 | 15.5 |
| 55 | Fluid and electrolyte disorders | 396,551 | 73,721 | 18.6 |
| 56 | Cystic fibrosis | 10,518 | 1,366 | 13.0 |
| Diseases of Blood and Blood-Forming Organs | ||||
| 59 | Anemia | 203,098 | 42,374 | 20.9 |
| 60 | Acute posthemorrhagic anemia | 27,199 | 5,239 | 19.3 |
| 61 | Sickle cell anemia | 87,326 | 27,837 | 31.9 |
| 62 | Coagulation and hemorrhagic disorders | 33,397 | 7,920 | 23.7 |
| 63 | Disease of white blood cells | 54,861 | 16,771 | 30.6 |
| Mental Disorders | ||||
| 650 | Adjustment disorders | 49,073 | 3,980 | 8.1 |
| 651 | Anxiety disorders | 45,102 | 5,519 | 12.2 |
| 652 | Attention-deficit, conduct, and disruptive behavior disorders | 18,218 | 1,692 | 9.3 |
| 653 | Delirium, dementia, and amnestic and other cognitive disorders | 131,003 | 21,566 | 16.5 |
| 655 | Disorders diagnosed in infancy, childhood, or adolescence | 5,613 | 753 | 13.4 |
| 656 | Impulse control disorders, NEC | 12,204 | 1,652 | 13.5 |
| 657 | Mood disorders | 883,245 | 131,125 | 14.8 |
| 658 | Personality disorders | 5,436 | 1,316 | 24.2 |
| 659 | Schizophrenia and other psychotic disorders | 397,166 | 88,629 | 22.3 |
| 660 | Alcohol-related disorders | 245,289 | 45,033 | 18.4 |
| 661 | Substance-related disorders | 212,612 | 32,050 | 15.1 |
| 663 | Screening and history of mental health and substance abuse | 60,417 | 15,695 | 26.0 |
| 670 | Miscellaneous mental disorders | 43,193 | 4,189 | 9.7 |
| Diseases of Nervous System and Sense Organs | ||||
| 76 | Meningitis | 32,909 | 2,565 | 7.8 |
| 77 | Encephalitis | 8,487 | 1,219 | 14.4 |
| 79 | Parkinson's disease | 13,089 | 2,118 | 16.2 |
| 80 | Multiple sclerosis | 21,708 | 2,529 | 11.6 |
| 82 | Paralysis | 7,394 | 987 | 13.3 |
| 83 | Epilepsy, convulsions | 252,200 | 31,965 | 12.7 |
| 84 | Headache, including migraine | 70,782 | 7,373 | 10.4 |
| 85 | Coma, stupor, and brain damage | 16,823 | 2,740 | 16.3 |
| 89 | Blindness and vision defects | 5,364 | 521 | 9.7 |
| 90 | Inflammation, infection of eye | 15,984 | 1,201 | 7.5 |
| 92 | Otitis media and related conditions | 9,855 | 738 | 7.5 |
| 93 | Conditions associated with dizziness or vertigo | 69,022 | 4,964 | 7.2 |
| Diseases of the Circulatory System | ||||
| 96 | Heart valve disorders | 100,327 | 20,613 | 20.5 |
| 97 | Peri-, endo-, and myocarditis, cardiomyopathy | 66,648 | 11,986 | 18.0 |
| 98 | Essential hypertension | 72,930 | 7,721 | 10.6 |
| 99 | Hypertension with complications and secondary hypertension | 211,243 | 45,309 | 21.4 |
| 100 | Acute myocardial infarction | 520,901 | 85,932 | 16.5 |
| 101 | Coronary atherosclerosis | 666,897 | 90,147 | 13.5 |
| 102 | Nonspecific chest pain | 601,899 | 61,465 | 10.2 |
| 103 | Pulmonary heart disease | 162,269 | 25,599 | 15.8 |
| 105 | Conduction disorders | 58,074 | 6,386 | 11.0 |
| 106 | Cardiac dysrhythmias | 705,616 | 104,607 | 14.8 |
| 107 | Cardiac arrest and ventricular fibrillation | 8,063 | 1,398 | 17.3 |
| 108 | Congestive heart failure, nonhypertensive | 847,073 | 209,017 | 24.7 |
| 109 | Acute cerebrovascular disease | 520,793 | 71,174 | 13.7 |
| 110 | Occlusion or stenosis of precerebral arteries | 111,833 | 11,877 | 10.6 |
| 112 | Transient cerebral ischemia | 166,904 | 16,436 | 9.8 |
| 113 | Late effects of cerebrovascular disease | 18,829 | 2,981 | 15.8 |
| 114 | Peripheral and visceral atherosclerosis | 162,792 | 28,031 | 17.2 |
| 115 | Aortic, peripheral, and visceral artery aneurysms | 73,143 | 11,247 | 15.4 |
| 116 | Aortic and peripheral arterial embolism or thrombosis | 26,104 | 5,381 | 20.6 |
| 118 | Phlebitis, thrombophlebitis and thromboembolism | 154,023 | 23,640 | 15.3 |
| 120 | Hemorrhoids | 30,467 | 4,003 | 13.1 |
| Diseases of the Respiratory System | ||||
| 122 | Pneumonia | 924,160 | 144,894 | 15.7 |
| 123 | Influenza | 10,284 | 776 | 7.5 |
| 124 | Acute and chronic tonsillitis | 31,874 | 1,097 | 3.4 |
| 125 | Acute bronchitis | 78,848 | 7,461 | 9.5 |
| 127 | Chronic obstructive pulmonary disease and bronchiectasis | 606,186 | 126,443 | 20.9 |
| 128 | Asthma | 347,404 | 41,320 | 11.9 |
| 129 | Aspiration pneumonitis, food/vomitus | 147,837 | 31,772 | 21.5 |
| 130 | Pleurisy, pneumothorax, pulmonary collapse | 101,298 | 21,485 | 21.2 |
| 131 | Respiratory failure, insufficiency, arrest (adult) | 260,781 | 59,842 | 22.9 |
| 132 | Lung disease due to external agents | 5,477 | 966 | 17.6 |
| Diseases of the Digestive System | ||||
| 135 | Intestinal infection | 207,083 | 36,451 | 17.6 |
| 136 | Disorders of teeth and jaw | 25,722 | 1,621 | 6.3 |
| 137 | Disease of mouth, excluding dental | 19,009 | 1,966 | 10.3 |
| 138 | Esophageal disorders | 125,280 | 16,921 | 13.5 |
| 139 | Gastroduodenal ulcer (except hemorrhage) | 42,462 | 6,170 | 14.5 |
| 140 | Gastritis and duodenitis | 99,130 | 15,355 | 15.5 |
| 142 | Appendicitis and other appendiceal conditions | 262,024 | 12,875 | 4.9 |
| 143 | Abdominal hernia | 174,459 | 19,885 | 11.4 |
| 144 | Regional enteritis and ulcerative colitis | 94,732 | 17,579 | 18.6 |
| 145 | Intestinal obstruction without hernia | 315,128 | 51,135 | 16.2 |
| 146 | Diverticulosis and diverticulitis | 289,097 | 35,461 | 12.3 |
| 147 | Anal and rectal conditions | 47,035 | 5,326 | 11.3 |
| 148 | Peritonitis and intestinal abscess | 25,219 | 6,315 | 25.0 |
| 149 | Biliary tract disease | 430,988 | 48,062 | 11.2 |
| 152 | Pancreatic disorders (not diabetes) | 282,159 | 49,936 | 17.7 |
| 153 | Gastrointestinal hemorrhage | 320,613 | 54,154 | 16.9 |
| 154 | Noninfectious gastroenteritis | 144,507 | 17,262 | 11.9 |
| Diseases of the Genitourinary System | ||||
| 156 | Nephritis, nephrosis, renal sclerosis | 7,561 | 1,473 | 19.5 |
| 157 | Acute and unspecified renal failure | 326,586 | 70,756 | 21.7 |
| 158 | Chronic renal failure | 17,394 | 4,766 | 27.4 |
| 159 | Urinary tract infections | 522,921 | 84,858 | 16.2 |
| 160 | Calculus of urinary tract | 154,073 | 15,938 | 10.3 |
| 163 | Genitourinary symptoms and ill-defined conditions | 32,102 | 5,711 | 17.8 |
| 164 | Hyperplasia of prostate | 55,298 | 5,505 | 10.0 |
| 165 | Inflammatory conditions of male genital organs | 23,662 | 2,344 | 9.9 |
| 167 | Nonmalignant breast conditions | 19,482 | 1,668 | 8.6 |
| 168 | Inflammatory disease of female pelvic organs | 38,989 | 3,225 | 8.3 |
| 169 | Endometriosis | 33,918 | 1,621 | 4.8 |
| 170 | Prolapse of female genital organs | 105,048 | 2,847 | 2.7 |
| 171 | Menstrual disorders | 87,633 | 4,311 | 4.9 |
| 172 | Ovarian cyst | 36,491 | 2,374 | 6.5 |
| 173 | Menopausal disorders | 9,602 | 654 | 6.8 |
| Complications of Pregnancy, Childbirth, and the Puerperium | ||||
| 180 | Ectopic pregnancy | 20,948 | 784 | 3.7 |
| 182 | Hemorrhage during pregnancy, abruptio placenta, placenta previa | 46,191 | 6,847 | 14.8 |
| 183 | Hypertension complicating pregnancy, childbirth and the puerperium | 230,927 | 22,091 | 9.6 |
| 184 | Early or threatened labor | 179,175 | 37,797 | 21.1 |
| 185 | Prolonged pregnancy | 250,122 | 3,591 | 1.4 |
| 186 | Diabetes or abnormal glucose tolerance complicating pregnancy | 84,725 | 5,384 | 6.4 |
| 187 | Malposition, malpresentation | 132,312 | 2,918 | 2.2 |
| 188 | Fetopelvic disproportion, obstruction | 65,609 | 1,255 | 1.9 |
| 189 | Previous C-section | 462,378 | 7,046 | 1.5 |
| 190 | Fetal distress and abnormal forces of labor | 170,752 | 3,893 | 2.3 |
| 191 | Polyhydramnios and other problems of amniotic cavity | 179,406 | 7,028 | 3.9 |
| 192 | Umbilical cord complication | 161,112 | 1,284 | 0.8 |
| 193 | Trauma to perineum and vulva | 610,073 | 5,046 | 0.8 |
| 196 | Normal pregnancy and/or delivery | 208,463 | 1,559 | 0.7 |
| Diseases of the Skin and Subcutaneous Tissue | ||||
| 197 | Skin and subcutaneous tissue infections | 576,902 | 64,680 | 11.2 |
| 199 | Chronic ulcer of skin | 50,845 | 10,823 | 21.3 |
| Diseases of the Musculoskeletal System and Connective Tissue | ||||
| 201 | Infective arthritis and osteomyelitis | 70,424 | 12,199 | 17.3 |
| 202 | Rheumatoid arthritis and related disease | 14,836 | 1,587 | 10.7 |
| 203 | Osteoarthritis | 872,661 | 42,241 | 4.8 |
| 205 | Spondylosis, intervertebral disc disorders, other back problems | 579,103 | 47,774 | 8.2 |
| 207 | Pathological fracture | 59,946 | 11,781 | 19.7 |
| 210 | Systemic lupus erythematosus and connective tissue disorders | 18,850 | 5,123 | 27.2 |
| Congenital Anomalies | ||||
| 213 | Cardiac and circulatory congenital anomalies | 23,824 | 2,610 | 11.0 |
| 214 | Digestive congenital anomalies | 6,100 | 626 | 10.3 |
| 215 | Genitourinary congenital anomalies | 7,480 | 729 | 9.7 |
| Injury and Poisoning | ||||
| 225 | Joint disorders and dislocations, trauma-related | 31,027 | 2,222 | 7.2 |
| 226 | Fracture of neck of femur (hip) | 291,847 | 38,668 | 13.2 |
| 227 | Spinal cord injury | 13,188 | 1,609 | 12.2 |
| 228 | Skull and face fractures | 45,409 | 3,164 | 7.0 |
| 229 | Fracture of upper limb | 136,326 | 10,895 | 8.0 |
| 230 | Fracture of lower limb | 234,607 | 23,540 | 10.0 |
| 232 | Sprains and strains | 29,538 | 2,356 | 8.0 |
| 233 | Intracranial injury | 162,589 | 18,304 | 11.3 |
| 234 | Crushing injury or internal injury | 85,422 | 7,744 | 9.1 |
| 235 | Open wounds of head, neck, and trunk | 29,547 | 2,028 | 6.9 |
| 236 | Open wounds of extremities | 38,921 | 2,847 | 7.3 |
| 237 | Complication of device, implant or graft | 596,062 | 121,036 | 20.3 |
| 238 | Complications of surgical procedures or medical care | 453,266 | 81,353 | 17.9 |
| 239 | Superficial injury, contusion | 40,973 | 4,975 | 12.1 |
| 240 | Burns | 34,452 | 3,431 | 10.0 |
| 241 | Poisoning by psychotropic agents | 60,590 | 6,496 | 10.7 |
| 242 | Poisoning by other medications and drugs | 107,558 | 13,426 | 12.5 |
| 243 | Poisoning by nonmedicinal substances | 15,356 | 1,121 | 7.3 |
| Symptoms, Signs, and Ill-Defined Conditions | ||||
| 245 | Syncope | 235,483 | 24,686 | 10.5 |
| 246 | Fever of unknown origin | 53,785 | 9,322 | 17.3 |
| 247 | Lymphadenitis | 13,632 | 1,242 | 9.1 |
| 248 | Gangrene | 33,786 | 10,693 | 31.6 |
| 250 | Nausea and vomiting | 51,833 | 11,854 | 22.9 |
| 251 | Abdominal pain | 166,071 | 26,993 | 16.3 |
| 252 | Malaise and fatigue | 33,141 | 6,054 | 18.3 |
| 253 | Allergic reactions | 23,860 | 2,482 | 10.4 |
| 254 | Rehabilitation care, fitting of prostheses, adjustment of devices | 47,035 | 5,008 | 10.6 |
| Source: Weighted national estimates from a readmissions analysis file derived from the Healthcare Cost and Utilization Project (HCUP) State Inpatient Databases (SID), 2010, Agency for Healthcare Research and Quality (AHRQ). * Information is provided for diagnoses with 5,000 or more weighted index stays and 500 or more weighted readmissions. See text and Definitions for details on methods for calculating readmissions. |
||||
Data Source
The estimates in this Statistical Brief are based on a readmissions analysis file that was created with the Healthcare Cost and Utilization Project (HCUP) State Inpatient Databases (SID). These databases include reliable, verified synthetic patient identifiers that can be used to track a person across hospitals within a State. Estimates were taken from HCUPnet, the online query system that provides free access to information from HCUP: https://datatools.ahrq.gov/hcupnet. HCUPnet provides access to health statistics and information on hospital inpatient and emergency department utilization, and it includes analytic tables using the readmissions analysis file. HCUPnet provides additional detailed results and sortable tables that provide instant information on readmissions to the hospital within 30 days of discharge. For 2010, readmissions data were available from 18 States: Alaska, Arkansas, California, Florida, Georgia, Hawaii, Louisiana, Massachusetts, Mississippi, Missouri, Nebraska, New Mexico, New York, South Carolina, Tennessee, Utah, Virginia, and Washington. These 18 States are geographically dispersed and accounted for 46 percent of the total U.S. resident population and 45 percent of the total U.S. hospitalizations. The readmissions analysis file included 14.0 million unweighted discharges. The study population in this readmissions analysis file included discharges from community, non-rehabilitation, non-specialty hospitals. Weights for national estimates were developed using poststratification on hospital characteristics (Census region, urban-rural location, teaching capabilities, bed size, and control/ownership) and patient age groups. Definitions Diagnoses, ICD-9-CM, and Clinical Classifications Software (CCS) For the index stay, the diagnoses examined in this Statistical Brief are based on the CCS for the principal diagnosis. The principal diagnosis is that condition established after study to be chiefly responsible for the patient's admission to the hospital. ICD-9-CM is the International Classification of Diseases, Ninth Revision, Clinical Modification, which assigns numeric codes to diagnoses. There are approximately 14,000 ICD-9-CM diagnosis codes. CCS categorizes ICD-9-CM diagnoses into a manageable number of clinically meaningful categories.11 This "clinical grouper" makes it easier to quickly understand patterns of diagnoses. CCS categories identified as "Other" typically are not reported; these categories include miscellaneous, otherwise unclassifiable diagnoses that may be difficult to interpret as a group. Readmissions The 30-day readmission rate is defined as the number of admissions for each condition for which there was at least one subsequent hospital admission within 30 days divided by the total number of admissions from January through November 2010. That is, when patients are discharged from the hospital, they are followed for 30 days in the data. If any readmission to the same or different hospital occurs during this time period, the admission is counted as a readmission. No more than one readmission is counted within the 30-day period, because the outcome measure assessed here is "percentage of admissions who are readmitted." If a patient was transferred to a different hospital on the same day or was transferred within the same hospital, the two events were combined as a single stay and the second event was not counted as a readmission; that is, transfers were not considered a readmission. In the case of admissions for which there was more than one readmission in the 30-day period, the data presented in this Statistical Brief reflect the characteristics and costs of the first readmission. Every qualifying hospital stay is counted as a separate index (starting point) admission. Thus, a single patient can be counted multiple times during the course of the January through November observation period. In addition, index admissions do not require a prior "clean period" with no hospitalizations; that is, a hospital stay may be a readmission for a prior stay and the index admission for a subsequent readmission. Admissions were disqualified from the analysis as index admissions if they could not be followed for 30 days for one of the following reasons: (1) admissions in which the patient died in the hospital, (2) admissions missing information on length of stay, and (3) admissions discharged in December 2010. Types of hospitals included in HCUP HCUP is based on data from community hospitals, which are defined as short-term, non-Federal, general, and other hospitals, excluding hospital units of other institutions (e.g., prisons). HCUP data include obstetrics and gynecology, otolaryngology, orthopedic, cancer, pediatric, public, and academic medical hospitals. Excluded are long-term care, rehabilitation, psychiatric, and alcoholism and chemical dependency hospitals. Payer (Insurance Status) Payer is the expected payer for the hospital stay. To make coding uniform across all HCUP data sources, payer combines detailed categories into more general groups:
About HCUP HCUP is a family of powerful healthcare databases, software tools, and products for advancing research. Sponsored by the Agency for Healthcare Research and Quality (AHRQ), HCUP includes the largest all-payer encounter-level collection of longitudinal healthcare data (inpatient, ambulatory surgery, and emergency department) in the United States, beginning in 1988. HCUP is a Federal-State-Industry Partnership that brings together the data collection efforts of many organizations—such as State data organizations, hospital associations, private data organizations, and the Federal government—to create a national information resource. HCUP would not be possible without the contributions of the following data collection Partners from across the United States: Alaska State Hospital and Nursing Home Association Arizona Department of Health Services Arkansas Department of Health California Office of Statewide Health Planning and Development Colorado Hospital Association Connecticut Hospital Association Florida Agency for Health Care Administration Georgia Hospital Association Hawaii Health Information Corporation Illinois Department of Public Health Indiana Hospital Association Iowa Hospital Association Kansas Hospital Association Kentucky Cabinet for Health and Family Services Louisiana Department of Health and Hospitals Maine Health Data Organization Maryland Health Services Cost Review Commission Massachusetts Center for Health Information and Analysis Michigan Health & Hospital Association Minnesota Hospital Association Mississippi Department of Health Missouri Hospital Industry Data Institute Montana MHA - An Association of Montana Health Care Providers Nebraska Hospital Association Nevada Department of Health and Human Services New Hampshire Department of Health & Human Services New Jersey Department of Health New Mexico Department of Health New York State Department of Health North Carolina Department of Health and Human Services North Dakota (data provided by the Minnesota Hospital Association) Ohio Hospital Association Oklahoma State Department of Health Oregon Association of Hospitals and Health Systems Oregon Health Policy and Research Pennsylvania Health Care Cost Containment Council Rhode Island Department of Health South Carolina Budget & Control Board South Dakota Association of Healthcare Organizations Tennessee Hospital Association Texas Department of State Health Services Utah Department of Health Vermont Association of Hospitals and Health Systems Virginia Health Information Washington State Department of Health West Virginia Health Care Authority Wisconsin Department of Health Services Wyoming Hospital Association About the SID The HCUP State Inpatient Databases (SID) are hospital inpatient databases from data organizations participating in HCUP. The SID contain the universe of the inpatient discharge abstracts in the participating HCUP States, translated into a uniform format to facilitate multistate comparisons and analyses. Together, the SID encompass more than 95 of all U.S. community hospital discharges in 2010. The SID can be used to investigate questions unique to one State, to compare data from two or more States, to conduct market area variation analyses, and to identify State-specific trends in inpatient care utilization, access, charges, and outcomes. About HCUPnet HCUPnet is an online query system that offers instant access to the largest set of all-payer healthcare databases publicly available. HCUPnet has an easy step-by-step query system, allowing for tables and graphs to be generated on national and regional statistics as well as trends for community hospitals in the United States. HCUPnet generates statistics using data from HCUP's Nationwide Inpatient Sample (NIS), the Kids' Inpatient Database (KID), the Nationwide Emergency Department Sample (NEDS), the State Inpatient Databases (SID), and the State Emergency Department Databases (SEDD). For More Information For more information about HCUP, visit http://www.hcup-us.ahrq.gov/. For additional HCUP statistics, visit HCUPnet, our interactive query system, at https://datatools.ahrq.gov/hcupnet. HCUPnet provides ready-to-use tables on readmission rates by condition and procedure (using Clinical Classification Software categories), diagnosis related groups (DRGs), and major diagnostic categories (MDCs). Suggested Citation Elixhauser A (AHRQ), Steiner C (AHRQ). Readmissions to U.S. Hospitals by Diagnosis, 2010. HCUP Statistical Brief #153. April 2013. Agency for Healthcare Research and Quality, Rockville, MD. http://www.hcup-us.ahrq.gov/reports/statbriefs/sb153.pdf. Acknowledgements The authors would like to acknowledge the contributions of Marguerite Barrett and Minya Sheng for work on programming. *** AHRQ welcomes questions and comments from readers of this publication who are interested in obtaining more information about access, cost, use, financing, and quality of healthcare in the United States. We also invite you to tell us how you are using this Statistical Brief and other HCUP data and tools, and to share suggestions on how HCUP products might be enhanced to further meet your needs. Please e-mail us at hcup@ahrq.gov or send a letter to the address below:Irene Fraser, Ph.D., Director Center for Delivery, Organization, and Markets Agency for Healthcare Research and Quality 540 Gaither Road Rockville, MD 20850 1 Boutwell A, Jencks S. It's Not Six of One, Half-Dozen of the Other: A Comparative Analysis of Three Rehospitalization Measurement Systems for Massachusetts. 2011 AcademyHealth Annual Research Meeting and National Quality Forum. www.qualityforum.org. Accessed March 21, 2013. 2 3M Health Information Systems. Potentially Preventable Readmissions Classification System, Methodology Overview, Document number GRP-139, May, 2008. http://www.illinois.gov/hfs/SiteCollectionDocuments/3MPotentiallyPreventableReadmissions.pdf. 3 Hospital Compare. Medicare website. https://www.medicare.gov/hospitalcompare/search.html. Accessed November 8, 2017. 4 Boutwell AE, Johnson MB, Rutherford P, Watson SR, Vecchioni N, Auerbach BS, Griswold P, Noga P, Wagner C. An early look at a four-state initiative to reduce avoidable hospital readmissions. Health Aff (Millwood). 2011 Jul;30(7):1272-80. 5 Partnership for Patients: Better Care, Lower Costs. April, 2011. http://www.healthcare.gov/news/factsheets/2011/04/partnership04122011a.html. Accessed March 21, 2013. 6 Jencks SF, Williams MV, Coleman EA. Rehospitalizations among patients in the Medicare fee-for-service program. N Engl J Med 2009;360:1418-28. 7 Stranges E, Barrett ML, Wier LM, Andrews RM. Readmissions for Heart Attack, 2009. HCUP Statistical Brief #140. August 2012. Agency for Healthcare Research and Quality, Rockville, MD. http://www.hcup-us.ahrq.gov/reports/statbriefs/sb140.pdf. Accessed March 21, 2013. 8 Elixhauser A, Au D, Podulka J. Readmissions for Chronic Obstructive Pulmonary Disease, 2008. HCUP Statistical Brief #121. September, 2011. Agency for Healthcare Research and Quality, Rockville, MD. http://www.hcup-us.ahrq.gov/reports/statbriefs/sb121.pdf. Accessed March 21, 2013. 9 https://datatools.ahrq.gov/hcupnet 10 Two additional conditions met these criteria; however, these conditions are the subject of separate HCUP Statistical Briefs. (Chronic obstructive pulmonary disease: http://www.hcup-us.ahrq.gov/reports/statbriefs/sb121.jsp and Septicemia: forthcoming in 2013). 11 HCUP Clinical Classifications Software (CCS). Healthcare Cost and Utilization Project (HCUP). U.S. Agency for Healthcare Research and Quality, Rockville, MD. Updated March 2013. http://www.hcup-us.ahrq.gov/toolssoftware/ccs/ccs.jsp. Accessed March 21, 2013. |