STATISTICAL BRIEF #255 |
March 2020
Lawrence D. Reid, Ph.D., M.P.H., and Kathryn R. Fingar, Ph.D., M.P.H. Introduction Traumatic brain injury (TBI) is defined as sudden damage to the brain caused by a bump, blow, jolt, or penetrating injury to the head.1 TBIs have short- and long-term consequences, including the need for acute hospital care, emotional and behavioral changes (e.g., depression, attention-deficit hyperactivity disorder), impaired neurologic function, complications from intracranial hemorrhage, and death.2,3 Children and older adults who sustain a TBI are at higher risk for these consequences, compared with individuals in other age groups.4,5 Hospital-based care for TBI is often more costly, and the lasting effects of the injury may result in returning to the hospital for additional care.6 This Healthcare Cost and Utilization Project (HCUP) Statistical Brief presents statistics on initial and subsequent TBI-related inpatient stays and treat-and-release emergency department (ED) visits (i.e., those that do not result in admission to the same hospital) using the 2017 National Inpatient Sample (NIS) and the 2017 Nationwide Emergency Department Sample (NEDS). Readmission rates following inpatient stays for TBI-related injuries also are presented using the 2017 Nationwide Readmissions Database (NRD). TBIs are categorized as those involving cerebral hemorrhage; mild to severe TBIs without cerebral hemorrhage, but that involve injuries more complex than concussion (e.g., cerebral edema); and uncomplicated concussion. First, patient and injury-related characteristics of inpatient stays and ED visits with any TBI diagnosis (principal or secondary) are shown. Second, outcomes of inpatient stays with a principal diagnosis of TBI are described, including length of stay, average cost per stay, and rates of in-hospital mortality and all-cause 30-day readmissions. Because of the large sample size of the HCUP NIS, NEDS, and NRD small differences can be statistically significant. Thus, only differences between groups greater than or equal to 10 percent are noted in the text. |
|
Findings
Characteristics of TBI-related inpatient stays and treat-and-release ED visits, 2017 Table 1 presents patient and hospitals characteristics of TBI-related inpatient stays and ED visits in 2017. The percentage distribution is shown, as well as the population rate for patient characteristics. |
| Table 1. Characteristics of TBI-related inpatient stays and treat-and-release ED visits, 2017 | ||||||
| Characteristic | Inpatient stays | ED visits | ||||
|---|---|---|---|---|---|---|
| N | % | Ratea | N | % | Ratea | |
| Total, non-TBI injury-related stays or visits | 2,575,400 | n/a | 792 | 25,569,200 | n/a | 7,864 |
| Total, TBI-related stays or visits | 326,600 | 100.0 | 100 | 801,700 | 100.0 | 247 |
| Age, years | ||||||
| <5 | 8,100 | 2.5 | 40 | 32,400 | 4.0 | 162 |
| 5-17 | 15,000 | 4.6 | 28 | 208,400 | 26.0 | 386 |
| 18-34 | 49,200 | 15.1 | 65 | 221,200 | 27.6 | 293 |
| 35-64 | 96,600 | 29.6 | 77 | 217,600 | 27.1 | 173 |
| 65+ | 157,700 | 48.3 | 314 | 122,200 | 15.2 | 243 |
| Sex | ||||||
| Male | 198,500 | 60.8 | 124 | 428,800 | 53.5 | 268 |
| Female | 128,000 | 39.2 | 78 | 372,800 | 46.5 | 226 |
| Primary expected payerb | ||||||
| Medicare, 65+ years | 136,000 | 41.6 | —a | 101,100 | 12.6 | —a |
| Medicare, <65 years | 14,800 | 4.5 | —a | 26,300 | 3.3 | —a |
| Medicaid | 52,600 | 16.1 | —a | 190,100 | 23.7 | —a |
| Private insurance | 85,100 | 26.1 | —a | 330,500 | 41.2 | —a |
| Self-pay/No charge | 20,300 | 6.2 | —a | 87,200 | 10.9 | —a |
| Community-level income | ||||||
| Quartile 1 (lowest) | 90,200 | 27.6 | 110 | 209,600 | 26.1 | 256 |
| Quartile 2 | 84,300 | 25.8 | 103 | 211,100 | 26.3 | 257 |
| Quartile 3 | 77,200 | 23.6 | 95 | 192,800 | 24.1 | 236 |
| Quartile 4 (highest) | 67,800 | 20.7 | 85 | 174,500 | 21.8 | 219 |
| Location of patient's residence | ||||||
| Metro | 273,700 | 83.8 | 98 | 645,800 | 80.6 | 232 |
| Rural, adjacent to metro area | 32,900 | 10.1 | 108 | 99,500 | 12.4 | 327 |
| Rural, remote | 17,300 | 5.3 | 110 | 52,300 | 6.5 | 331 |
| Region of patient's residence | ||||||
| Northeast | 55,100 | 16.9 | 98 | 150,500 | 18.8 | 266 |
| Midwest | 74,300 | 22.7 | 109 | 196,300 | 24.5 | 288 |
| South | 117,700 | 36.0 | 96 | 268,800 | 33.5 | 218 |
| West | 76,900 | 23.5 | 99 | 182,100 | 22.7 | 236 |
| Hospital ownership | ||||||
| Public | 51,400 | 15.7 | —a | 131,700 | 16.4 | —a |
| Private | 275,300 | 84.3 | —a | 670,000 | 83.6 | —a |
| Teaching status | ||||||
| Teaching | 275,600 | 84.4 | —a | 496,500 | 61.9 | —a |
| Nonteaching | 51,000 | 15.6 | —a | 305,300 | 38.1 | —a |
| Abbreviations: ED, emergency department; n/a, not applicable; TBI, traumatic brain injury Notes: TBI-related stays/visits include initial and subsequent encounters; non-TBI injury-related stays/visits include only the initial encounter for the injury. Percentages may not add to 100 percent because of missing data. Numbers of stays/visits are rounded to the nearest hundred. Percentages are calculated based on nonrounded values. a Rate per 100,000 population. Denominator data by payer are not available to calculate population rates. Population rates are calculated only for patient characteristics and not for hospital characteristics. b Self-pay/No charge: includes self-pay, no charge, charity, and no expected payment. 'Other' not shown (stays, 5.1%; visits, 7.7%). Source: Agency for Healthcare Research and Quality (AHRQ), Healthcare Cost and Utilization Project (HCUP), National Inpatient Sample (NIS) and Nationwide Emergency Department Sample (NEDS), 2017 | ||||||
|
| Table 2. Characteristics of injuries for TBI-related inpatient stays and treat-and-release ED visits, 2017 | ||||
| Injury characteristic | TBI-related inpatient stays | TBI-related treat-and-release ED visits | ||
|---|---|---|---|---|
| N | % | N | % | |
| Total | 326,600 | 100.0 | 801,700 | 100.0 |
| Principal (vs. secondary) TBI diagnosis | 216,200 | 66.2 | —a | —a |
| Subsequent (vs. initial) encounter | 27,800 | 8.5 | 13,800 | 1.7 |
| Head injury type | ||||
| Cerebral hemorrhage | 227,400 | 69.6 | 81,000 | 10.1 |
| Epiduralb | 13,500 | 4.1 | 3,900 | 0.5 |
| Subduralb | 149,800 | 45.9 | 50,100 | 6.3 |
| Subarachnoidb | 97,300 | 29.8 | 27,900 | 3.5 |
| Intracerebralb | 19,000 | 5.8 | 6,000 | 0.7 |
| TBI, mild to severe, without cerebral hemorrhage | 48,900 | 15.0 | 138,100 | 17.2 |
| Concussion, uncomplicated | 50,400 | 15.4 | 582,600 | 72.7 |
| Loss of consciousness | ||||
| >30 minutes or loss of any duration with death | 14,800 | 4.5 | 2,800 | 0.3 |
| <30 minutes | 40,400 | 12.4 | 123,000 | 15.3 |
| Loss of unspecified duration | 130,000 | 39.8 | 230,800 | 28.8 |
| None | 141,400 | 43.3 | 445,100 | 55.5 |
| Intent and mechanism of injury | ||||
| Unintentional, fall | 168,700 | 51.7 | 319,900 | 39.9 |
| Unintentional, MVT/other transport | 79,200 | 24.2 | 165,600 | 20.7 |
| Assault, all mechanisms | 17,700 | 5.4 | 68,300 | 8.5 |
| Unintentional, struck by/against | 6,700 | 2.1 | 150,800 | 18.8 |
| Other intent/mechanism | 11,900 | 3.7 | 29,600 | 3.7 |
| None listed | 42,400 | 13.0 | 67,600 | 8.4 |
| Sports-related diagnoses | ||||
| Contact or collision | 800 | 0.3 | 52,600 | 6.6 |
| Limited contact | 5,700 | 1.7 | 40,300 | 5.0 |
| Noncontact | 6,400 | 2.0 | 24,500 | 3.1 |
| Other | 600 | 0.2 | 3,100 | 0.4 |
| None listed | 313,100 | 95.8 | 681,300 | 85.0 |
| Abbreviations: ED, emergency department; MVT, motor vehicle traffic; TBI, traumatic brain injury Notes: Numbers of stays and visits are rounded to the nearest hundred. Percentages are calculated based on nonrounded values. a The order of diagnoses for ED data does not represent principal or secondary reasons for the encounter, as it does for inpatient data, and thus is not shown. b The four types of cerebral hemorrhage sum to more than the total because records could have multiple types of cerebral hemorrhage. Source: Agency for Healthcare Research and Quality (AHRQ), Healthcare Cost and Utilization Project (HCUP), National Inpatient Sample (NIS) and Nationwide Emergency Department Sample (NEDS), 2017 | ||||
|
|
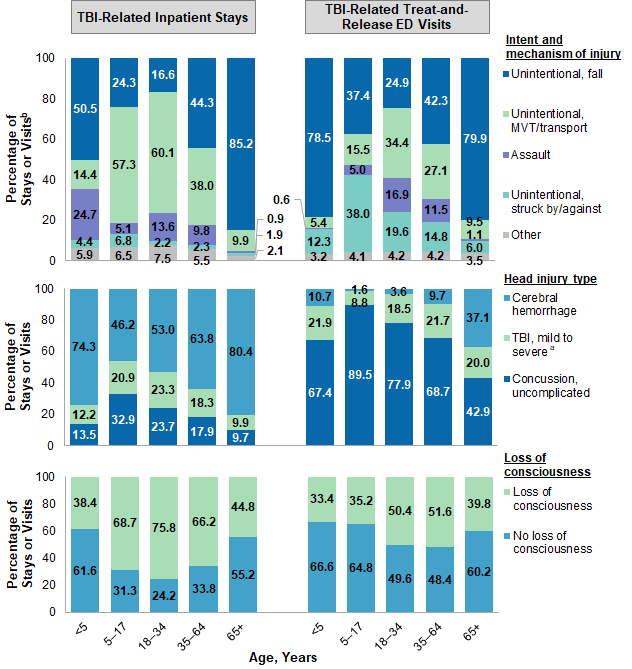
Figure 1. Intent/mechanism of injury, type of head injury, and loss of consciousness among TBI-related inpatient stays and treat-and-release ED visits, by patient age group, 2017
Abbreviations: ED, emergency department; TBI, traumatic brain injury Six bar charts that show the percentage of TBI-related inpatient stays and treat-and-release emergency visits by intent/mechanism of injury, type of head injury, and loss of consciousness by age group in 2017. Data are provided in Supplemental Table 1.
|
Table 3 presents outcomes of inpatient stays with a principal TBI diagnosis in 2017, by select patient, hospital, and injury-related characteristics. |
| Table 3. Outcomes of inpatient stays with a principal TBI diagnosis, by select characteristics, 2017 | ||||
| Patient, hospital, or injury characteristic | Length of stay, days, mean | Cost per stay, $, mean | In- hospital death, % | All-cause 30-day readmission, % |
|---|---|---|---|---|
| Total, stays with no TBI diagnosis in any field | 4.6 | 12,100 | 1.9 | 12.6 |
| Total, stays principally diagnosed for TBI | 6.8 | 21,000 | 7.9 | 11.9 |
| Age, years | ||||
| <5 | 5.4 | 20,400 | 4.4 | 3.1 |
| 5-17 | 7.0 | 27,300 | 6.3 | 2.4 |
| 18-34 | 8.2 | 30,600 | 8.5 | 5.9 |
| 35-64 | 7.8 | 25,000 | 7.6 | 11.1 |
| 65+ | 6.0 | 16,600 | 8.2 | 14.6 |
| Sex | ||||
| Male | 7.5 | 23,700 | 8.7 | 12.0 |
| Female | 5.7 | 17,100 | 6.7 | 11.8 |
| Primary expected payer | ||||
| Medicare, 65+ years | 5.8 | 16,100 | 7.7 | 14.8 |
| Medicare, <65 years | 6.9 | 20,700 | 6.8 | 16.8 |
| Medicaid | 9.7 | 32,500 | 8.2 | 9.7 |
| Private insurance | 6.9 | 23,900 | 7.1 | 7.8 |
| Self-pay/No chargea | 6.1 | 20,900 | 12.2 | 7.3 |
| Hospital ownership | ||||
| Public | 7.7 | 29,200 | 9.8 | 11.0 |
| Private | 6.6 | 19,600 | 7.6 | 12.1 |
| Teaching status | ||||
| Teaching | 6.9 | 22,000 | 8.2 | 11.9 |
| Nonteaching | 6.0 | 16,000 | 6.6 | 11.9 |
| Head injury type | ||||
| Cerebral hemorrhage | 7.0 | 21,800 | 8.4 | 13.1 |
| Epidural | 6.7 | 26,000 | 3.9 | 7.6 |
| Subdural | 6.9 | 20,900 | 8.4 | 15.4 |
| Subarachnoid | 7.1 | 22,900 | 8.6 | 10.3 |
| Intracerebral | 7.2 | 21,700 | 9.6 | 10.1 |
| TBI, mild to severe, without hemorrhage | 7.9 | 24,200 | 10.1 | 8.3 |
| Concussion, uncomplicated | 2.9 | 10,000 | 0.4 | 5.4 |
| Loss of consciousness | ||||
| Any | 7.6 | 25,200 | 11.2 | 10.3 |
| None | 5.9 | 16,400 | 4.3 | 13.5 |
| Intent and mechanism of injury | ||||
| Unintentional, fall | 5.7 | 16,400 | 6.9 | 13.8 |
| Unintentional, MVT/other transport | 8.6 | 31,000 | 8.4 | 6.8 |
| Assault all mechanisms | 6.8 | 22,600 | 6.6 | 9.0 |
| Unintentional, struck by/against | 4.8 | 15,700 | 4.4 | 11.2 |
| Sports-related diagnoses | ||||
| Contact or collision | 1.9 | 8,400 | —b | 2.9 |
| Limited contact | 5.0 | 21,000 | 4.0 | 5.6 |
| Noncontact | 5.2 | 17,600 | 6.7 | 11.0 |
| Abbreviations: ED, emergency department; MVT, motor vehicle traffic; TBI, traumatic brain injury Notes: Costs are rounded to the nearest hundred. Other payers, intents/mechanisms, and sports-related diagnoses are not shown. a Self-pay/No charge: includes self-pay, no charge, charity, and no expected payment. b Suppressed because of cell size <11. Source: Agency for Healthcare Research and Quality (AHRQ), Healthcare Cost and Utilization Project (HCUP), National Inpatient Sample (NIS) and Nationwide Readmissions Database (NRD), 2017. | ||||
Healthcare Cost and Utilization Project (HCUP) Statistical Briefs provide basic descriptive statistics on a variety of topics using HCUP administrative healthcare data. Topics include hospital inpatient, ambulatory surgery, and emergency department use and costs, quality of care, access to care, medical conditions, procedures, and patient populations, among other topics. The reports are intended to generate hypotheses that can be further explored in other research; the reports are not designed to answer in-depth research questions using multivariate methods. Data Source The estimates in this Statistical Brief are based upon data from the HCUP 2017 National Inpatient Sample (NIS), Nationwide Emergency Department Sample (NEDS), and Nationwide Readmissions Database (NRD). Supplemental sources included population denominator data for use with HCUP databases, derived from information available from the U.S. Census Bureau.7 Definitions Diagnoses, ICD-10-CM, and Clinical Classifications Software Refined (CCSR) for ICD-10-CM diagnoses The principal diagnosis is that condition established after study to be chiefly responsible for the patient's admission to the hospital. Secondary diagnoses are concomitant conditions that coexist at the time of admission or develop during the stay. All-listed diagnoses include the principal diagnosis plus these additional secondary conditions. ICD-10-CM is the International Classification of Diseases, Tenth Revision, Clinical Modification diagnosis coding system. In October 2015, ICD-10-CM replaced the International Classification of Diseases, Ninth Revision, Clinical Modification (ICD-9-CM) diagnosis coding system for most inpatient and outpatient medical encounters. There are over 70,000 ICD-10-CM diagnosis codes. The CCSR for ICD-10-CM aggregates the diagnosis codes into a manageable number of clinically meaningful categories.8 The CCSR for ICD-10-CM is intended to be used analytically to examine patterns of healthcare in terms of cost, utilization and outcomes, rank utilization by diagnoses, and risk adjust by clinical condition. The CCSR capitalizes on the specificity of the ICD-10-CM coding scheme and allows ICD-10-CM codes to be classified in more than one category. Approximately 10 percent of diagnosis codes are associated with more than one CCSR category because the diagnosis code documents either multiple conditions or a condition along with a common symptom or manifestation. For this Statistical Brief, the principal diagnosis code is assigned to a single default CCSR based on clinical coding guidelines, etiology and pathology of diseases, and standards set by other Federal agencies. The assignment of the default CCSR for the principal diagnosis is available starting with version v2020.2 of the software tool. Case definition The CCSR categories defining traumatic brain injury (TBI) are listed below. The exact ICD-10-CM codes included in these categories can be found in the CCSR documentation.9
Types of traumatic brain injury were identified by the following values for the first through fifth digits of the ICD-10-CM codes in the TBI-related CCSR categories. If multiple codes were present, the following hierarchy was used to assign the record to only one category.
Loss of consciousness was identified by the following values for the sixth digit of the ICD-10-CM codes in the TBI-related CCSR categories. If multiple codes were present, the following hierarchy was used to assign the record to only one category.
Intent and mechanism of injury were identified by the ICD-10-CM external cause of injury matrix for causes other than poisoning developed by the Centers for Disease Control and Prevention.10 If multiple codes were present, the following hierarchy was used to assign the record to only one category:
Non-TBI injury-related stays and visits Initial stays and visits that were not TBI-related but that involved other injuries were identified based on all-listed diagnoses by the following ICD-10-CM codes and CCSR categories, which can be found in the CCSR documentation.11 Subsequent encounters for the same injuries were not included.
The following ICD-10-CM codes were used to define sports-related injuries.12 |
| Table 4. ICD-10-CM codes used to define sports-related injuries | |
| ICD-10-CM code | Description |
|---|---|
| Contact or collision | |
| Y9312 | Activity, springboard and platform diving |
| Y9313 | Activity, water polo |
| Y9322 | Activity, ice hockey |
| Y9361 | Activity, American tackle football |
| Y9363 | Activity, rugby |
| Y9365 | Activity, lacrosse and field hockey |
| Y9366 | Activity, soccers |
| Y9367 | Activity, basketball |
| Y9371 | Activity, boxing |
| Y9372 | Activity, wrestling |
| Y9375 | Activity, martial arts |
| Limited contact | |
| Y9317 | Activity, water skiing and wake boarding |
| Y9318 | Activity, surfing, windsurfing and boogie boarding |
| Y9319 | Activity, other involving water and watercraft |
| Y9321 | Activity, ice skating |
| Y9323 | Activity, snow (alpine) (downhill) skiing, snowboarding, sledding, tobogganing and snow tubing |
| Y9324 | Activity, cross country skiing |
| Y9329 | Activity, other involving ice and snow |
| Y9343 | Activity, gymnastics |
| Y9344 | Activity, trampolining |
| Y9345 | Activity, cheerleading |
| Y9349 | Activity, other involving dancing and other rhythmic movements |
| Y9351 | Activity, roller skating (inline) and skateboarding |
| Y9352 | Activity, horseback riding |
| Y9355 | Activity, bike riding |
| Y9357 | Activity, non-running track and field events |
| Y9359 | Activity, other involving other sports and athletics played individually |
| Y9362 | Activity, American flag or touch football |
| Y9364 | Activity, baseball |
| Y9368 | Activity, volleyball (beach) (court) |
| Y9369 | Activity, other involving other sports and athletics played as a team or group |
| Noncontact/noncollision | |
| Y9301 | Activity, walking, marching and hiking |
| Y9302 | Activity, running |
| Y9311 | Activity, swimming |
| Y9314 | Activity, water aerobics and water exercise |
| Y9315 | Activity, underwater diving and snorkeling |
| Y9316 | Activity, rowing, canoeing, kayaking, rafting and tubing |
| Y9341 | Activity, dancing |
| Y9342 | Activity, yoga |
| Y9353 | Activity, golf |
| Y9354 | Activity, bowling |
| Y9356 | Activity, jumping rope |
| Y936A | Activity, physical games generally associated with school recess, summer camp and children |
| Y9373 | Activity, racquet and hand sports |
| Y9374 | Activity, frisbee |
| Y93A1 | Activity, exercise machines primarily for cardiorespiratory conditioning |
| Y93A2 | Activity, calisthenics |
| Y93A3 | Activity, aerobic and step exercise |
| Y93A4 | Activity, circuit training |
| Y93A5 | Activity, obstacle course |
| Y93A6 | Activity, grass drills |
| Y93A9 | Activity, other involving cardiorespiratory exercise |
| Y93B1 | Activity, exercise machines primarily for muscle strengthening |
| Y93B2 | Activity, push-ups, pull-ups, sit-ups |
| Y93B3 | Activity, free weights |
| Y93B4 | Activity, pilates |
| Y93B9 | Activity, other involving muscle strengthening exercises |
| Y9381 | Activity, refereeing a sports activity |
| Other | |
| Y9331 | Activity, mountain climbing, rock climbing and wall climbing |
| Y9332 | Activity, rappelling |
| Y9333 | Activity, BASE jumping |
| Y9334 | Activity, bungee jumping |
| Y9335 | Activity, hang gliding |
| Y9339 | Activity, other involving climbing, rappelling and jumping off |
| Y9379 | Activity, other specified sports and athletics |
| Abbreviations: ICD-10-CM, International Classification of Diseases, Tenth Revision, Clinical Modification | |
Readmissions The 30-day readmission rate is defined as the number of admissions for each condition for which there was at least one subsequent hospital admission within 30 days, divided by the total number of admissions from January through November of the same year. That is, when patients are discharged from the hospital, they are followed for 30 days in the data. If any readmission to the same or different hospital occurs during this time period, the admission is counted as having a readmission. No more than one readmission is counted within the 30-day period, because the outcome measure assessed is "percentage of admissions that are readmitted." If a patient was transferred to a different hospital on the same day or was transferred within the same hospital, the two events were combined as a single stay and the second event was not counted as a readmission; that is, transfers were not considered a readmission. In the case of admissions for which there was more than one readmission in the 30-day period, the data presented in this Statistical Brief reflect the characteristics and costs of the first readmission. Every qualifying hospital stay is counted as a separate initial (starting point) admission. Thus, a single patient can be counted multiple times during the course of the January through November observation period. In addition, initial admissions do not require a prior "clean period" with no hospitalizations; that is, a hospital stay may be a readmission for a prior stay and the initial admission for a subsequent readmission. Admissions were disqualified from the analysis as initial admissions if they could not be followed for 30 days for one of the following reasons: (1) the patient died in the hospital, (2) information on length of stay was missing, or (3) the patient was discharged in December. Types of hospitals included in the HCUP National Inpatient Sample The National Inpatient Sample (NIS) is based on data from community hospitals, which are defined as short-term, non-Federal, general, and other hospitals, excluding hospital units of other institutions (e.g., prisons). The NIS includes obstetrics and gynecology, otolaryngology, orthopedic, cancer, pediatric, public, and academic medical hospitals. Excluded are long-term care facilities such as rehabilitation, psychiatric, and alcoholism and chemical dependency hospitals. Beginning in 2012, long-term acute care hospitals are also excluded. However, if a patient received long-term care, rehabilitation, or treatment for a psychiatric or chemical dependency condition in a community hospital, the discharge record for that stay will be included in the NIS. Types of hospitals included in the HCUP Nationwide Emergency Department Sample The Nationwide Emergency Department Sample (NEDS) is based on data from community hospitals, which are defined as short-term, non-Federal, general, and other hospitals, excluding hospital units of other institutions (e.g., prisons). The NEDS includes specialty, pediatric, public, and academic medical hospitals. Excluded are long-term care facilities such as rehabilitation, psychiatric, and alcoholism and chemical dependency hospitals. Hospitals included in the NEDS have hospital-owned emergency departments (ED) and no more than 90 percent of their ED visits resulting in admission. Types of hospitals included in the HCUP Nationwide Readmissions Database The Nationwide Readmissions Database (NRD) is based on data from community hospitals, which are defined as short-term, non-Federal, general, and other hospitals, excluding hospital units of other institutions (e.g., prisons). The NRD includes obstetrics and gynecology, otolaryngology, orthopedic, cancer, pediatric, public, and academic medical hospitals. Excluded are long-term care facilities such as rehabilitation, long-term acute care, psychiatric, and alcoholism and chemical dependency hospitals. However, if a patient received long-term care, rehabilitation, or treatment for a psychiatric or chemical dependency condition in a community hospital, the discharge record for that stay will be included in the NRD. Unit of analysis The unit of analysis is the hospital discharge (i.e., the hospital stay) or the ED visit, not a person or patient. This means that a person who is admitted to the hospital or seen in the ED multiple times in 1 year will be counted each time as a separate discharge from the hospital or visit in the ED. Population rates Rates of stays or visits per 100,000 population were calculated using 2017 hospital discharge and treat-and-release ED visit totals in the numerator and U.S. Census Bureau 13 estimates of the 2017 U.S. population in the denominator. Individual patients hospitalized or seen in the ED multiple times are counted more than once in the numerator. Population rate = number of stays or visits divided into number of U.S. residents times 100,000. Costs and charges Total hospital charges were converted to costs using HCUP Cost-to-Charge Ratios based on hospital accounting reports from the Centers for Medicare & Medicaid Services (CMS).14 Costs reflect the actual expenses incurred in the production of hospital services, such as wages, supplies, and utility costs; charges represent the amount a hospital billed for the case. For each hospital, a hospital-wide cost-to-charge ratio is used. Hospital charges reflect the amount the hospital billed for the entire hospital stay and do not include professional (physician) fees. For the purposes of this Statistical Brief, costs are reported to the nearest hundred. Location of patient's residence Place of residence is based on the rural-urban continuum codes (RUCC) for U.S. counties developed by the United States Department of Agriculture (USDA).15 For this Statistical Brief, we collapsed the RUCC codes into the following three categories: Metro:
Community-level income is based on the median household income of the patient's ZIP Code of residence. Quartiles are defined so that the total U.S. population is evenly distributed. Cut-offs for the quartiles are determined annually using ZIP Code demographic data obtained from Claritas, a vendor that produces population estimates and projections based on data from the U.S. Census Bureau.16 The value ranges for the income quartiles vary by year. The income quartile is missing for patients who are homeless or foreign. Expected payer To make coding uniform across all HCUP data sources, the primary expected payer for the hospital stay or ED visit combines detailed categories into general groups:
For this Statistical Brief, when more than one payer is listed for a hospital discharge or ED visit, the first-listed payer is used. Region Region is one of the four regions defined by the U.S. Census Bureau:
Discharge status reflects the disposition of the patient at discharge from the hospital, including patients who died in the hospital. About HCUP The Healthcare Cost and Utilization Project (HCUP, pronounced "H-Cup") is a family of healthcare databases and related software tools and products developed through a Federal-State-Industry partnership and sponsored by the Agency for Healthcare Research and Quality (AHRQ). HCUP databases bring together the data collection efforts of State data organizations, hospital associations, and private data organizations (HCUP Partners) and the Federal government to create a national information resource of encounter-level healthcare data. HCUP includes the largest collection of longitudinal hospital care data in the United States, with all-payer, encounter-level information beginning in 1988. These databases enable research on a broad range of health policy issues, including cost and quality of health services, medical practice patterns, access to healthcare programs, and outcomes of treatments at the national, State, and local market levels. HCUP would not be possible without the contributions of the following data collection Partners from across the United States: Alaska Department of Health and Social Services Alaska State Hospital and Nursing Home Association Arizona Department of Health Services Arkansas Department of Health California Office of Statewide Health Planning and Development Colorado Hospital Association Connecticut Hospital Association Delaware Division of Public Health District of Columbia Hospital Association Florida Agency for Health Care Administration Georgia Hospital Association Hawaii Laulima Data Alliance, a subsidiary of the Healthcare Association of Hawaii Illinois Department of Public Health Indiana Hospital Association Iowa Hospital Association Kansas Hospital Association Kentucky Cabinet for Health and Family Services Louisiana Department of Health Maine Health Data Organization Maryland Health Services Cost Review Commission Massachusetts Center for Health Information and Analysis Michigan Health & Hospital Association Minnesota Hospital Association Mississippi State Department of Health Missouri Hospital Industry Data Institute Montana Hospital Association Nebraska Hospital Association Nevada Department of Health and Human Services New Hampshire Department of Health & Human Services New Jersey Department of Health New Mexico Department of Health New York State Department of Health North Carolina Department of Health and Human Services North Dakota (data provided by the Minnesota Hospital Association) Ohio Hospital Association Oklahoma State Department of Health Oregon Association of Hospitals and Health Systems Oregon Office of Health Analytics Pennsylvania Health Care Cost Containment Council Rhode Island Department of Health South Carolina Revenue and Fiscal Affairs Office South Dakota Association of Healthcare Organizations Tennessee Hospital Association Texas Department of State Health Services Utah Department of Health Vermont Association of Hospitals and Health Systems Virginia Health Information Washington State Department of Health West Virginia Department of Health and Human Resources, West Virginia Health Care Authority Wisconsin Department of Health Services Wyoming Hospital Association About the NIS The HCUP National Inpatient Sample (NIS) is a nationwide database of hospital inpatient stays. The NIS is nationally representative of all community hospitals (i.e., short-term, non-Federal, nonrehabilitation hospitals). The NIS includes all payers. It is drawn from a sampling frame that contains hospitals comprising more than 95 percent of all discharges in the United States. The vast size of the NIS allows the study of topics at the national and regional levels for specific subgroups of patients. In addition, NIS data are standardized across years to facilitate ease of use. Over time, the sampling frame for the NIS has changed; thus, the number of States contributing to the NIS varies from year to year. The NIS is intended for national estimates only; no State-level estimates can be produced. The unweighted sample size for the 2017 NIS is 7,159,694 (weighted, this represents 35,798,453 inpatient stays). About the NEDS The HCUP Nationwide Emergency Department Database (NEDS) is a unique and powerful database that yields national estimates of emergency department (ED) visits. The NEDS was constructed using records from both the HCUP State Emergency Department Databases (SEDD) and the State Inpatient Databases (SID). The SEDD capture information on ED visits that do not result in an admission (i.e., patients who were treated in the ED and then released from the ED, or patients who were transferred to another hospital); the SID contain information on patients initially seen in the ED and then admitted to the same hospital. The NEDS was created to enable analyses of ED utilization patterns and support public health professionals, administrators, policymakers, and clinicians in their decisionmaking regarding this critical source of care. The NEDS is produced annually beginning in 2006. Over time, the sampling frame for the NEDS has changed; thus, the number of States contributing to the NEDS varies from year to year. The NEDS is intended for national estimates only; no State-level estimates can be produced. The unweighted sample size for the 2017 NEDS is 33,506,645 (weighted, this represents 144,814,803 ED visits). About the NRD The HCUP Nationwide Readmissions Database (NRD) is a calendar-year, discharge-level database constructed from the HCUP State Inpatient Databases (SID) with verified patient linkage numbers that can be used to track a person across hospitals within a State. The 2017 NRD is available for purchase through the HCUP Central Distributor. The NRD is designed to support various types of analyses of national readmission rates. The database includes discharges for patients with and without repeat hospital visits in a year and those who have died in the hospital. Repeat stays may or may not be related. The criteria to determine the relationship between hospital admissions are left to the analyst using the NRD. The NRD was constructed as a sample of convenience consisting of 100 percent of the eligible discharges. Discharge weights for national estimates are developed using the target universe of community hospitals (excluding rehabilitation and long-term acute care hospitals) in the United States. Over time, the sampling frame for the NRD will change; thus, the number of States contributing to the NRD will vary from year to year. The NRD is intended for national estimates only; no regional, State-, or hospital-specific estimates can be produced. The unweighted sample size for the 2017 NRD is 17,978,754 (weighted, this represents 35,790,513 inpatient stays). For More Information For other information on injuries, including traumatic brain injury, refer to the HCUP Statistical Briefs located at www.hcup-us.ahrq.gov/reports/statbriefs/sb_injurypoisoning.jsp. For additional HCUP statistics, visit:
For a detailed description of HCUP and more information on the design of the National Inpatient Sample (NIS), Nationwide Emergency Department Sample (NEDS), and Nationwide Readmissions Database (NRD), please refer to the following database documentation: Agency for Healthcare Research and Quality. Overview of the National (Nationwide) Inpatient Sample (NIS). Healthcare Cost and Utilization Project (HCUP). Rockville, MD: Agency for Healthcare Research and Quality. Updated December 2019. www.hcup-us.ahrq.gov/nisoverview.jsp. Accessed February 3, 2020. Agency for Healthcare Research and Quality. Overview of the Nationwide Emergency Department Sample (NEDS). Healthcare Cost and Utilization Project (HCUP). Rockville, MD: Agency for Healthcare Research and Quality. Updated December 2019. www.hcup-us.ahrq.gov/nedsoverview.jsp. Accessed February 3, 2020. Agency for Healthcare Research and Quality. Overview of the Nationwide Readmissions Database (NRD). Healthcare Cost and Utilization Project (HCUP). Rockville, MD: Agency for Healthcare Research and Quality. Updated December 2019. www.hcup-us.ahrq.gov/nrdoverview.jsp. Accessed February 3, 2020. Suggested Citation Reid LD (AHRQ), Fingar KR (IBM Watson Health). Inpatient Stays and Emergency Department Visits Involving Traumatic Brain Injury, 2017. HCUP Statistical Brief #255. March 2020. Agency for Healthcare Research and Quality, Rockville, MD. www.hcup-us.ahrq.gov/reports/statbriefs/sb255-Traumatic-Brain-Injury-Hospitalizations-ED-Visits-2017. Acknowledgments The authors would like to acknowledge the contributions of Minya Sheng and Tim Burrell of IBM Watson Health. *** AHRQ welcomes questions and comments from readers of this publication who are interested in obtaining more information about access, cost, use, financing, and quality of healthcare in the United States. We also invite you to tell us how you are using this Statistical Brief and other HCUP data and tools, and to share suggestions on how HCUP products might be enhanced to further meet your needs. Please e-mail us at hcup@ahrq.gov or send a letter to the address below:Joel W. Cohen, Ph.D., Director Center for Financing, Access and Cost Trends Agency for Healthcare Research and Quality 5600 Fishers Lane Rockville, MD 20857 This Statistical Brief was posted online on March 31, 2020 1 Centers for Disease Control and Prevention. Traumatic Brain Injury & Concussion. www.cdc.gov/traumaticbraininjury/index.html. Accessed November 25, 2019. 2 Yeates KO, Swift E, Taylor HG, Wade SL, Drotar D, Stancin T, et al. Short- and long-term social outcomes following pediatric traumatic brain injury. Journal of the International Neuropsychological Society. 2004;10(3):412-26. 3 Taylor CA, Bell JM, Breiding MJ, Xu L. Traumatic brain injury-related emergency department visits, hospitalizations, and deaths — United States, 2007 and 2013. Morbidity and Mortality Weekly Report. 2017;66(9):1-16. 4 Ibid. 5 Nishijima DK, Offerman SR, Ballard DW, Vinson DR, Chettipally UK, Rauchwerger AS, et al. Risk of traumatic intracranial hemorrhage in patients with head injury and preinjury warfarin or clopidogrel use. Academic Emergency Medicine. 2013;20(2):140-5. 6 Van Deynse H, Van Belleghem G, Lauwaert D, Moens M, Pien K, Devos S, et al. The incremental cost of traumatic brain injury during the first year after a road traffic accident. Brain Injury. 2019;33(9):1234-44. 7 Barrett M, Coffey R, Levit K. Population Denominator Data for Use with the HCUP Databases (Updated with 2016 Population Data). HCUP Methods Series Report #2017-04. October 17, 2017. U.S. Agency for Healthcare Research and Quality. www.hcup-us.ahrq.gov/reports/methods/2017-04.pdf. Accessed February 28, 2020. 8 Agency for Healthcare Research and Quality. HCUP Clinical Classifications Software Refined (CCSR) for ICD-10-CM Diagnoses. Healthcare Cost and Utilization Project (HCUP). Agency for Healthcare Research and Quality. Updated January 2020. www.hcup-us.ahrq.gov/toolssoftware/ccsr/ccs_refined.jsp. Accessed February 27, 2020. 9 Ibid. 10 Centers for Disease Control and Prevention. Proposed ICD-10-CM External Cause of Injury Matrix for Causes other than Poisoning. ftp.cdc.gov/pub/TBI/injury/icd10/ICD-10-CM_Non-Poisoning_Cause_Matrix.xlsx. Accessed November 26, 2019. 11 Agency for Healthcare Research and Quality. HCUP Clinical Classifications Software Refined (CCSR) for ICD-10-CM Diagnoses. Healthcare Cost and Utilization Project (HCUP). Agency for Healthcare Research and Quality. Updated January 2020. www.hcup-us.ahrq.gov/toolssoftware/ccsr/ccs_refined.jsp. Accessed February 27, 2020. 12 Rice SG, American Academy of Pediatrics Council on Sports Medicine and Fitness. Medical conditions affecting sports participation. Pediatrics. 2008;121(4):841-8. 13 Barrett M, Coffey R, Levit K. Population Denominator Data for Use with the HCUP Databases (Updated with 2016 Population Data). HCUP Methods Series Report #2017-04. October 17, 2017. U.S. Agency for Healthcare Research and Quality. www.hcup-us.ahrq.gov/reports/methods/2017-04.pdf. Accessed February 28, 2020. 14 Agency for Healthcare Research and Quality. HCUP Cost-to-Charge Ratio (CCR) Files. Healthcare Cost and Utilization Project (HCUP). 2001-2017. Agency for Healthcare Research and Quality. Updated December 2019.www.hcup-us.ahrq.gov/db/state/costtocharge.jsp. Accessed February 3, 2020. 15 United States Department of Agriculture. Rural-Urban Continuum Codes. www.ers.usda.gov/data-products/rural-urban-continuum-codes/. Accessed February 27, 2020. 16 Claritas. Claritas Demographic Profile by ZIP Code. claritas360.claritas.com/mybestsegments/. |
| Supplemental Table 1. Intent/mechanism, type of head injury, and loss of consciousness among TBI-related inpatient stays and treat-and-release ED visits, by patient age group, 2017 | ||||||||||
| Injury characteristic | TBI-related inpatient stays, age in years | TBI-related treat-and-release ED visits, age in years | ||||||||
|---|---|---|---|---|---|---|---|---|---|---|
| <5 | 5-17 | 18-34 | 35-64 | 65+ | <5 | 5-17 | 18-34 | 35-64 | 65+ | |
| Manner/mechanism of injury, % | ||||||||||
| Unintentional, fall | 50.5 | 24.3 | 16.6 | 44.3 | 85.2 | 78.5 | 37.4 | 24.9 | 42.3 | 79.9 |
| Unintentional, MVT/transport | 14.4 | 57.3 | 60.1 | 38.0 | 9.9 | 5.4 | 15.5 | 34.4 | 27.1 | 9.5 |
| Assault | 24.7 | 5.1 | 13.6 | 9.8 | 0.9 | 0.6 | 5.0 | 16.9 | 11.5 | 1.1 |
| Unintentional, struck by/against | 4.4 | 6.8 | 2.2 | 2.3 | 1.9 | 12.3 | 38.0 | 19.6 | 14.8 | 6.0 |
| Other | 5.9 | 6.5 | 7.5 | 5.5 | 2.1 | 3.2 | 4.1 | 4.2 | 4.2 | 3.5 |
| Head injury type, % | ||||||||||
| Cerebral hemorrhage | 74.3 | 46.2 | 53.0 | 63.8 | 80.4 | 10.7 | 1.6 | 3.6 | 9.7 | 37.1 |
| TBI, mild to severe, without cerebral hemorrhage | 12.2 | 20.9 | 23.3 | 18.3 | 9.9 | 21.9 | 8.8 | 18.5 | 21.7 | 20.0 |
| Concussion, uncomplicated | 13.5 | 32.9 | 23.7 | 17.9 | 9.7 | 67.4 | 89.5 | 77.9 | 68.7 | 42.9 |
| Loss of consciousness, % | ||||||||||
| Loss of consciousness | 38.4 | 68.7 | 75.8 | 66.2 | 44.8 | 33.4 | 35.2 | 50.4 | 51.6 | 39.8 |
| No loss of consciousness | 61.6 | 31.3 | 24.2 | 33.8 | 55.2 | 66.6 | 64.8 | 49.6 | 48.4 | 60.2 |