|
TABLE OF CONTENTS HIGHLIGHTS INTRODUCTION HCUP PARTNERS 1. OVERVIEW 2. DIAGNOSES 3. PROCEDURES 4. COSTS 5. WOMEN'S HEALTH SOURCES/METHODS DEFINITIONS FOR MORE INFO ACKNOWLEDGMENTS CITATION FACTS & FIGURES 2009 PDF |
EXHIBIT 1.4 Discharge Status (PDF) 1.4a

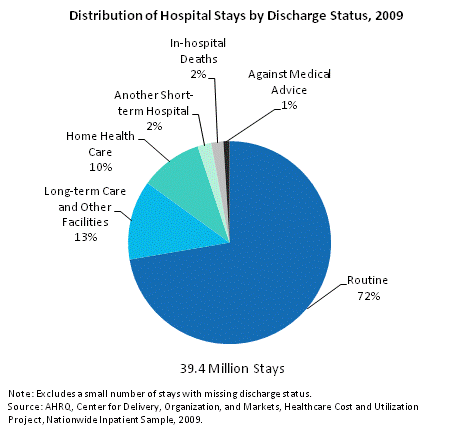
Distribution of hospital stays by discharge status, 2009. Pie chart. Routine: 72%; long-term care and other facilities: 13%; home healthcare: 10%; another short-term hospital: 2%; in-hospital deaths: 2%; against medical advice: 1%. 39.4 million total stays. Note: Excludes a small number of stays with missing discharge status. Source: AHRQ, Center for Delivery, Organization, and Markets, Healthcare Cost and Utilization Project, Nationwide Inpatient Sample, 2009.
Discharge status indicates the circumstance surrounding the discharge or where the patient went after discharge from the hospital. Most discharges were routine in nature, but discharges to follow-on care were also frequent.
1.4b

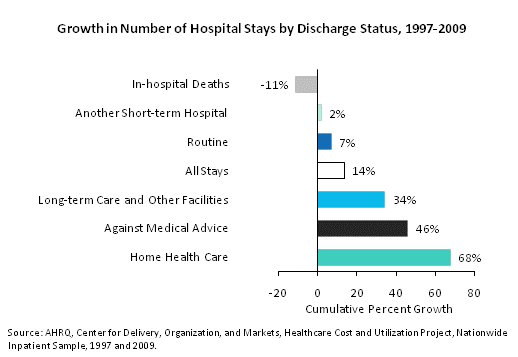
Growth in number of hospital stays by discharge status, 1997 through 2009. Bar chart. Cumulative percent growth. In-hospital deaths: -11%; another short-term hospital: 2%; routine: 7%; all stays: 14%; long-term care and other facilities: 34%; against medical advice: 46%; home healthcare: 68%. Source: AHRQ, Center for Delivery, Organization, and Markets, Healthcare Cost and Utilization Project, Nationwide Inpatient Sample, 1997 and 2009.
The total number of stays increased 14 percent from 1997 to 2009, but the rate of growth varied by discharge status.
1.4c

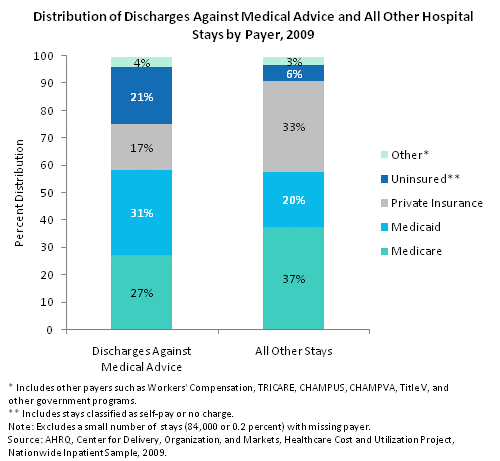
Distribution of discharges against medical advice and all other hospital stays by payer, 2009. Column chart. Percent distribution. Discharges against medical advice: other: 4%; uninsured: 21%; private insurance: 17%; Medicaid: 31%; Medicare: 27%. All other stays: other: 3%; uninsured: 6%; private insurance: 33%; Medicaid: 20%; Medicare: 37%. Note: Other includes payers such as Workers' Compensation, TRICARE, CHAMPUS, CHAMPVA, Title V, and other government programs. Note: Uninsured includes stays classified as self-pay or no charge. Note: Excludes a small number of stays (84,000 or 0.2%) with missing payer. Source: AHRQ, Center for Delivery, Organization, and Markets, Healthcare Cost and Utilization Project,
Nationwide Inpatient Sample, 2009.
|
| Internet Citation: Facts and Figures 2009. Healthcare Cost and Utilization Project (HCUP). November 2011. Agency for Healthcare Research and Quality, Rockville, MD. hcup-us.ahrq.gov/reports/factsandfigures/2009/exhibit1_4.jsp. |
| Are you having problems viewing or printing pages on this website? |
| If you have comments, suggestions, and/or questions, please contact hcup@ahrq.gov. |
| If you are experiencing issues related to Section 508 accessibility of information on this website, please contact hcup@ahrq.gov. |
| Privacy Notice, Viewers & Players |
| Last modified 11/9/11 |