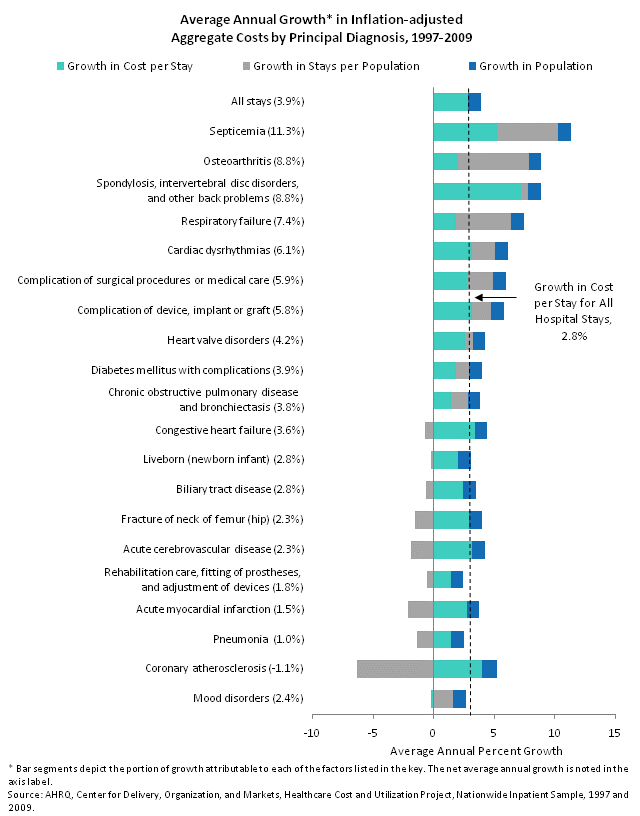
EXHIBIT 4.2 Cost Factors Accounting for Growth by Diagnosis
(PDF)
Exhibit 4.2 shows the average annual growth in aggregate costs for the twenty most costly reasons for hospitalization. The contribution of the growth in the number of stays, the growth in the cost per stay and population growth to the growth in aggregate costs of each condition are also indicated.
- Aggregate costs for stays in community hospitals grew 3.9 percent annually between 1997 and 2009. The factors that comprised this overall growth were:
- Greater intensity of services (cost per stay) provided during the hospital stay (averaging 2.8 percent annually),
- Population growth (up 1.0 percent annually), and
- Growth in the number of stays per person remained stable.
- Overall, growth in intensity of services accounted for 72 percent of the growth in aggregate costs, while population growth was responsible for 27 percent of total growth and an increased number of stays per population accounted for only 1.2 percent of growth.
- Higher than average growth in cost per stay, indicating greater intensity of service utilization and more expensive interventions, accounted for 81 percent of the growth in the costs of stays for spondylosis, while population growth and growth in stays per population accounted for 12 percent and 7 percent, respectively.
- Growth in stays per person made up the majority of the growth in costs for stays for:
- osteoarthritis,
- respiratory failure, and
- mood disorders.
- The increase in number of stays per person was a relatively more important factor in cost growth for the following stays than it was for stays overall:
- septicemia,
- cardiac dysrhythmias,
- complication of surgical procedures or medical care,
- complication of device, implant or graft,
- diabetes mellitus with complications, and
- chronic obstructive pulmonary disease and bronchiectasis.
- The decline in hospitalizations per population dampened increases in the net cost of hospital stays for:
- coronary artherosclerosis,
- congestive heart failure,
- acute cerebrovascular disease,
- fracture of neck of femur (hip),
- rehabilitation care,
- acute myocardial infarction, and
- pneumonia.
Previous Next