|
TABLE OF CONTENTS HIGHLIGHTS INTRODUCTION HCUP PARTNERS 1. OVERVIEW 2. DIAGNOSES 3. PROCEDURES 4. COSTS 5. WOMEN'S HEALTH SOURCES/METHODS DEFINITIONS FOR MORE INFO ACKNOWLEDGMENTS CITATION FACTS & FIGURES 2009 PDF |
EXHIBIT 4.3 Cost by Age (PDF) 4.3a 
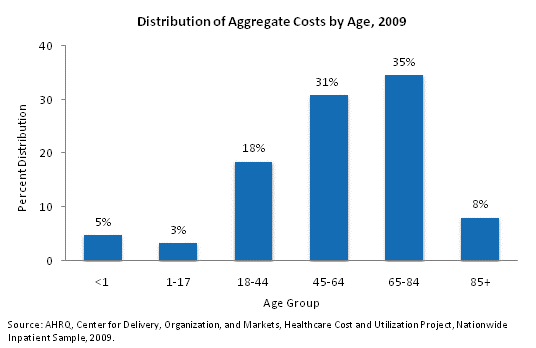
Distribution of aggregate costs by age, 2009. Column chart. Percent distribution. Less than 1: 5%; 1 to 17: 3%; 18 to 44: 18%; 45 to 64: 31%; 65 to 84: 35%; 85 and over: 8%. Source: AHRQ, Center for Delivery, Organization, and Markets, Healthcare Cost and Utilization Project, Nationwide Inpatient Sample, 2009.
In 2009, the aggregate cost for all hospital stays was $361.5 billion.
4.3b 
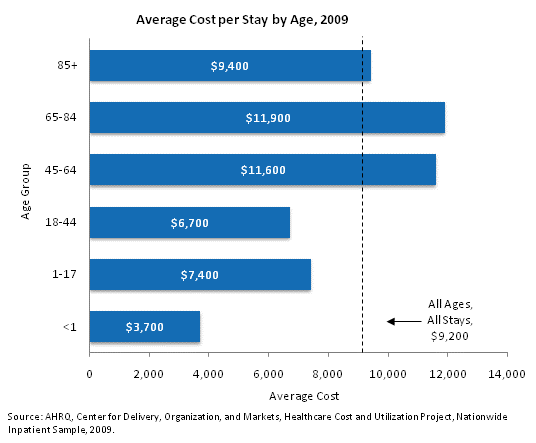
Average cost per stay by age, 2009. Bar chart. Average cost. All ages, all stays: $9,200. Less than 1: $3,700; 1 to 17: $7,400; 18 to 44: $6,700; 45 to 64: $11,600; 65 to 84: $11,900; 85 and over: $9,400. Source: AHRQ, Center for Delivery, Organization, and Markets, Healthcare Cost and Utilization Project, Nationwide Inpatient Sample, 2009.
|
| Internet Citation: Facts and Figures 2009. Healthcare Cost and Utilization Project (HCUP). November 2011. Agency for Healthcare Research and Quality, Rockville, MD. hcup-us.ahrq.gov/reports/factsandfigures/2009/exhibit4_3.jsp. |
| Are you having problems viewing or printing pages on this website? |
| If you have comments, suggestions, and/or questions, please contact hcup@ahrq.gov. |
| If you are experiencing issues related to Section 508 accessibility of information on this website, please contact hcup@ahrq.gov. |
| Privacy Notice, Viewers & Players |
| Last modified 11/9/11 |