TABLE OF CONTENTS
HIGHLIGHTS
INTRODUCTION
HCUP PARTNERS
1. OVERVIEW
2. DIAGNOSES
3. PROCEDURES
4. COSTS
5. WOMEN'S HEALTH
SOURCES/METHODS
DEFINITIONS
FOR MORE INFO
ACKNOWLEDGMENTS
CITATION
FACTS & FIGURES 2009 PDF
|
EXHIBIT 5.4 Procedures
(PDF)
5.4a
Number of Stays and Stays per 10,000 Population for the Most Frequent All-listed Procedures for Hospital Stays, Adults 18 Years and Older by Sex, 2009
| ALL-LISTED CCS PROCEDURES |
NUMBER OF STAYS IN THOUSANDS |
STAYS PER 10,000 POPULATION WITH THE PROCEDURE |
| MALES |
FEMALES |
MALES |
FEMALES |
| All stays with a procedure* |
18,529 |
27,598 |
1,635 |
2,316ξ |
| Female rates higher than male rates |
| Blood transfusion |
1,185 |
1,555 |
105 |
130ξ |
| Upper gastrointestinal endoscopy |
558 |
665 |
49 |
56ξ |
| Knee arthroplasty |
257 |
425 |
23 |
36ξ |
| Colonoscopy and biopsy |
232 |
324 |
21 |
27ξ |
| Cholecystectomy and common duct exploration |
161 |
288 |
14 |
24ξ |
| Hip replacement |
178 |
259 |
16 |
22ξ |
| Male rates higher than female rates |
| Diagnostic cardiac catheterization, coronary arteriography |
888 |
581 |
78 |
49ξ |
| Respiratory intubation and mechanical ventilation |
680 |
608 |
60 |
51ξ |
| Hemodialysis |
440 |
395 |
39 |
33ξ |
| Percutaneous transluminal coronary angioplasty (PTCA) |
457 |
236 |
40 |
20ξ |
| Incision of pleura, thoracentesis, chest drainage |
243 |
213 |
21 |
18ξ |
| Female rates not statistically different from male rates |
| Echocardiogram |
424 |
368 |
37 |
31 |
| Laminectomy, excision intervertebral disc |
249 |
247 |
22 |
21 |
| Spinal fusion |
205 |
233 |
18 |
20 |
| Enteral and parenteral nutrition |
210 |
220 |
19 |
18 |
| Female-specific procedures |
| Cesarean section |
- |
1,352 |
- |
113 |
| Repair of obstetric laceration |
- |
1,290 |
- |
108 |
| Artificial rupture of membranes to assist delivery |
- |
900 |
- |
76 |
| Fetal monitoring |
- |
830 |
- |
70 |
| Hysterectomy |
- |
481 |
- |
40 |
* Excludes a small number of stays (111,000 or 0.3 percent) with missing sex.
ξ Female stays per 10,000 population are statistically different from male stays per 10,000 population at p<0.05.
Source: AHRQ, Center for Delivery, Organization, and Markets, Healthcare Cost and Utilization Project, Nationwide Inpatient Sample, 2009.
|
Blood transfusion was the most common procedure for both sexes when childbirth and liveborn infant procedures are excluded.
Females had a higher rate of stays with the following procedures than males:
- The rate of stays with cholecystectomy and common duct exploration was 71 percent higher among females than males.
- The rate of stays with knee arthroplasty was 57 percent higher for females than males.
- Females had a 38-percent higher rate of stays for hip replacement than males.
- Colonoscopy and biopsy had a 29-percent higher rate of stays among females than males.
- The rate of stays with blood transfusion was 24 percent higher among females than males.
- The rate of stays with upper gastrointestinal endoscopy was 14 percent higher for females than males.
The rate of stays with the following procedures was higher for males than females:
- Two heart-related procedures—diagnostic cardiac catheterization and PTCAs —were performed more often for males than females.
- PTCAs were performed at twice the rate for males as females.
- Diagnostic cardiac catheterization was performed in 59 percent more stays for males than females.
- The male rates of stay with respiratory intubation and mechanical ventilation or hemodialysis were 18 percent higher than the female rates of stay.
- The rate of hospital stays that involved incision of the pleura was 17 percent higher for males than females.
For all other top ranking procedures (echocardiogram, laminectomy, spinal fusion, and enteral and parenteral nutrition), there was little difference between males and females in the rate of procedures performed.
5.4b

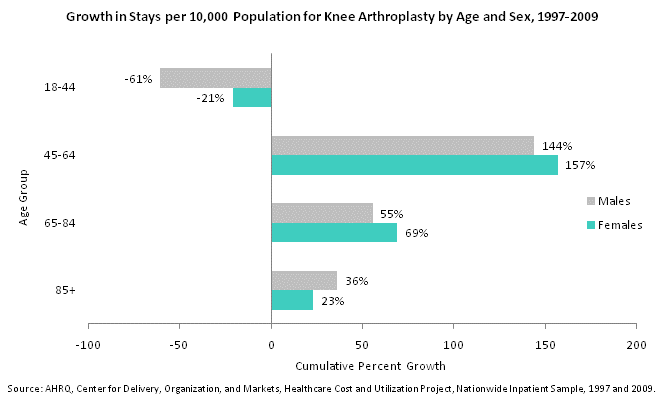
Growth in stays per 10,000 population for knee arthroplasty by age and sex, 1997 through 2009. Bar chart. Cumulative percent growth. 18 to 44. Females: -21%; males: -61%. 45 to 64. Females: 157%; males: 144%. 65 to 84. Females: 69%; males: 55%. 85 and over. Females: 23%; males: 36%. Source: AHRQ, Center for Delivery, Organization, and Markets, Healthcare Cost and Utilization Project, Nationwide Inpatient Sample, 1997 and 2009.
- The rate of knee arthroplasty for males and females 45-64 years old was about 2.5 times higher in 2009 than in 1997. The male rate increased 144 percent from 11 stays per 10,000 persons in 1997 to 28 in 2009, while it increased 157 percent from 16 stays per 10,000 persons in 1997 to 42 in 2009 for females.
- The rate of knee arthroplasty increased by 69 percent for females 65 to 84 years old (from 72 stays per 10,000 population in 1997 to 122 stays per 10,000 population in 2009), while it increased by only 55 percent for males (from 58 stays per 10,000 population in 1997 to 90 stays per 10,000 population in 2009).
5.4c

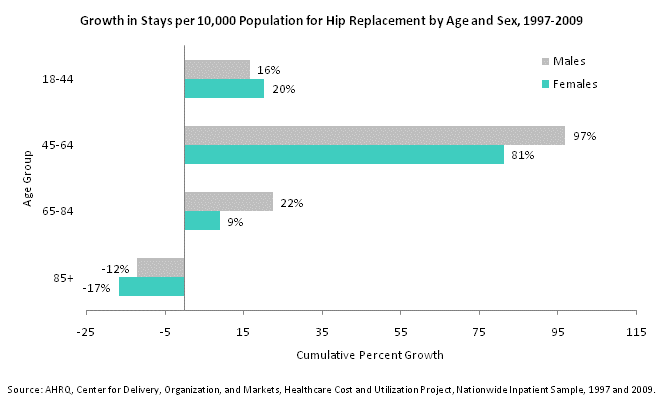
Growth in stays per 10,000 population for hip replacement by age and sex, 1997 through 2009. Bar chart. Cumulative percent growth. 18 to 44. Females: 20%; males: 16%. 45 to 64. Females: 81%; males: 97%. 65 to 84. Females: 9%; males: 22%. 85 and over. Females: -17%; males: -12%. Source: AHRQ, Center for Delivery, Organization, and Markets, Healthcare Cost and Utilization Project, Nationwide Inpatient Sample, 1997 and 2009.
- The rate of hip replacements decreased by 17 percent for females 85 years and older from 1997 to 2009 (from 139 stays per 10,000 population in 1997 to 116 stays per 10,000 population in 2009). The rate of hip replacements for males 85 years and older decreased by 12 percent over the same period (from 100 stays per 10,000 population in 1997 to 88 stays per 10,000 population in 2009).
- Hip replacements for females age 45 to 64 years old increased by 81 percent from 10 per 10,000 population in 1997 to 17 per 10,000 population in 2009. The rate for males in this period nearly doubled, from 10 per 10,000 population in 1997 to 19 per 10,000 population in 2009.
Previous Next
|

